
|
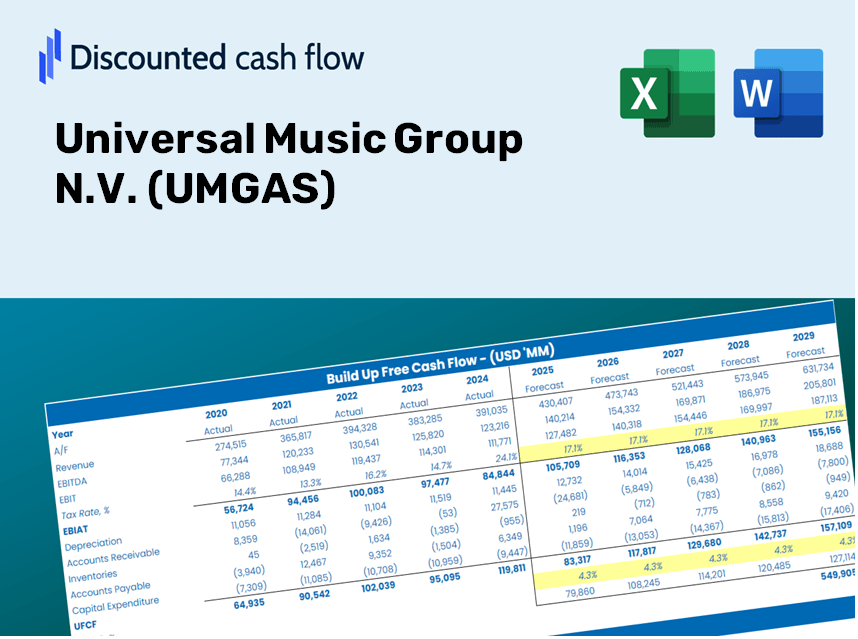
Universal Music Group N.V. (Umg.as) DCF -Bewertung |
Fully Editable: Tailor To Your Needs In Excel Or Sheets
Professional Design: Trusted, Industry-Standard Templates
Investor-Approved Valuation Models
MAC/PC Compatible, Fully Unlocked
No Expertise Is Needed; Easy To Follow
Universal Music Group N.V. (UMG.AS) Bundle
Entdecken Sie die Finanzaussichten von Universal Music Group N.V. (UMGAS) mit unserem benutzerfreundlichen DCF-Taschenrechner! Geben Sie Ihre Wachstumsannahmen, Margen und Kosten ein, um den inneren Wert der universellen Musikgruppe N.V. (UMGAS) zu bestimmen und formen Sie Ihren Investitionsansatz.
Discounted Cash Flow (DCF) - (USD MM)
| Year | AY1 2020 |
AY2 2021 |
AY3 2022 |
AY4 2023 |
AY5 2024 |
FY1 2025 |
FY2 2026 |
FY3 2027 |
FY4 2028 |
FY5 2029 |
|---|---|---|---|---|---|---|---|---|---|---|
| Revenue | 7,432.0 | 8,504.0 | 10,340.0 | 11,108.0 | 11,834.0 | 13,312.6 | 14,975.9 | 16,847.0 | 18,951.9 | 21,319.9 |
| Revenue Growth, % | 0 | 14.42 | 21.59 | 7.43 | 6.54 | 12.49 | 12.49 | 12.49 | 12.49 | 12.49 |
| EBITDA | 2,074.0 | 1,489.0 | 1,353.0 | 1,828.0 | 3,467.0 | 2,775.8 | 3,122.6 | 3,512.8 | 3,951.6 | 4,445.4 |
| EBITDA, % | 27.91 | 17.51 | 13.09 | 16.46 | 29.3 | 20.85 | 20.85 | 20.85 | 20.85 | 20.85 |
| Depreciation | 237.0 | 278.0 | 378.0 | 382.0 | 409.0 | 452.9 | 509.4 | 573.1 | 644.7 | 725.2 |
| Depreciation, % | 3.19 | 3.27 | 3.66 | 3.44 | 3.46 | 3.4 | 3.4 | 3.4 | 3.4 | 3.4 |
| EBIT | 1,837.0 | 1,211.0 | 975.0 | 1,446.0 | 3,058.0 | 2,322.9 | 2,613.2 | 2,939.7 | 3,306.9 | 3,720.1 |
| EBIT, % | 24.72 | 14.24 | 9.43 | 13.02 | 25.84 | 17.45 | 17.45 | 17.45 | 17.45 | 17.45 |
| Total Cash | 1,142.0 | 585.0 | 439.0 | 504.0 | 580.0 | 956.6 | 1,076.1 | 1,210.6 | 1,361.9 | 1,532.0 |
| Total Cash, percent | .0 | .0 | .0 | .0 | .0 | .0 | .0 | .0 | .0 | .0 |
| Account Receivables | 1,642.0 | 1,803.0 | 2,014.0 | 2,282.0 | 2,527.0 | 2,786.9 | 3,135.1 | 3,526.8 | 3,967.4 | 4,463.1 |
| Account Receivables, % | 22.09 | 21.2 | 19.48 | 20.54 | 21.35 | 20.93 | 20.93 | 20.93 | 20.93 | 20.93 |
| Inventories | 79.0 | 99.0 | 163.0 | 210.0 | 255.0 | 209.0 | 235.1 | 264.5 | 297.5 | 334.7 |
| Inventories, % | 1.06 | 1.16 | 1.58 | 1.89 | 2.15 | 1.57 | 1.57 | 1.57 | 1.57 | 1.57 |
| Accounts Payable | 121.0 | 146.0 | 138.0 | 118.0 | 168.0 | 190.7 | 214.5 | 241.3 | 271.4 | 305.4 |
| Accounts Payable, % | 1.63 | 1.72 | 1.33 | 1.06 | 1.42 | 1.43 | 1.43 | 1.43 | 1.43 | 1.43 |
| Capital Expenditure | -66.0 | -61.0 | -93.0 | -299.0 | -449.0 | -239.4 | -269.3 | -302.9 | -340.8 | -383.4 |
| Capital Expenditure, % | -0.88805 | -0.71731 | -0.89942 | -2.69 | -3.79 | -1.8 | -1.8 | -1.8 | -1.8 | -1.8 |
| Tax Rate, % | 27.34 | 27.34 | 27.34 | 27.34 | 27.34 | 27.34 | 27.34 | 27.34 | 27.34 | 27.34 |
| EBITAT | 1,409.0 | 921.0 | 847.2 | 1,057.8 | 2,221.9 | 1,790.8 | 2,014.5 | 2,266.2 | 2,549.3 | 2,867.9 |
| Depreciation | ||||||||||
| Changes in Account Receivables | ||||||||||
| Changes in Inventories | ||||||||||
| Changes in Accounts Payable | ||||||||||
| Capital Expenditure | ||||||||||
| UFCF | -20.0 | 982.0 | 849.2 | 805.8 | 1,941.9 | 1,813.1 | 1,904.2 | 2,142.1 | 2,409.7 | 2,710.8 |
| WACC, % | 7.38 | 7.38 | 7.42 | 7.37 | 7.36 | 7.38 | 7.38 | 7.38 | 7.38 | 7.38 |
| PV UFCF | ||||||||||
| SUM PV UFCF | 8,780.6 | |||||||||
| Long Term Growth Rate, % | 3.00 | |||||||||
| Free cash flow (T + 1) | 2,792 | |||||||||
| Terminal Value | 63,713 | |||||||||
| Present Terminal Value | 44,623 | |||||||||
| Enterprise Value | 53,404 | |||||||||
| Net Debt | 2,639 | |||||||||
| Equity Value | 50,765 | |||||||||
| Diluted Shares Outstanding, MM | 1,852 | |||||||||
| Equity Value Per Share | 27.41 |
What You'll Receive
- Pre-Filled Financial Model: Utilizes Universal Music Group N.V. (UMGAS) actual data for accurate DCF valuation.
- Comprehensive Forecast Control: Modify key metrics like revenue growth, profit margins, WACC, and more.
- Real-Time Calculations: Instant updates let you view results immediately as adjustments are made.
- Professional-Grade Template: A polished Excel file specifically crafted for high-quality valuation.
- Flexible and Reusable: Designed for adaptability, making it easy to conduct detailed forecasts repeatedly.
Key Features
- Real-Life UMGAS Data: Pre-loaded with Universal Music Group's historical revenues and future growth forecasts.
- Fully Customizable Inputs: Modify parameters such as revenue growth, profit margins, discount rates, tax rates, and capital investments.
- Dynamic Valuation Model: Automatic recalculations of Net Present Value (NPV) and intrinsic value based on your customized inputs.
- Scenario Testing: Develop various forecasting scenarios to evaluate different valuation possibilities.
- User-Friendly Design: Intuitive layout, organized for both seasoned professionals and newcomers.
How It Works
- Step 1: Download the Excel file.
- Step 2: Review pre-filled data for Universal Music Group N.V. (UMGAS), including both historical and projected figures.
- Step 3: Modify key assumptions (highlighted in yellow) based on your analysis.
- Step 4: Observe the automatic recalculations for Universal Music's intrinsic value.
- Step 5: Utilize the results to inform your investment decisions or reporting needs.
Why Choose the UMGAS Calculator?
- User-Friendly Interface: Perfectly suited for both newcomers and seasoned professionals.
- Customizable Inputs: Effortlessly adjust parameters to tailor your financial analysis.
- Real-Time Valuation: Instantly observe how changes affect Universal Music Group's valuation as you tweak inputs.
- Preloaded Data: Comes with Universal Music Group's actual financial information for swift evaluations.
- Relied Upon by Experts: A favorite tool among investors and analysts for making informed decisions.
Who Can Benefit from This Product?
- Investors: Evaluate Universal Music Group’s (UMGAS) valuation prior to trading stocks.
- CFOs and Financial Analysts: Enhance valuation workflows and assess financial projections.
- Startup Founders: Discover how leading music companies like Universal Music Group are valued.
- Consultants: Create comprehensive valuation reports for your clients.
- Students and Educators: Utilize real data to practice and impart valuation strategies.
Contents of the Template
- Historical Data: Contains past financial information and baseline forecasts for Universal Music Group N.V. (UMGAS).
- DCF and Levered DCF Models: Comprehensive templates to assess the intrinsic value of Universal Music Group N.V. (UMGAS).
- WACC Sheet: Pre-calculated figures for the Weighted Average Cost of Capital.
- Editable Inputs: Adjust key drivers such as growth rates, EBITDA percentages, and CAPEX assumptions.
- Quarterly and Annual Statements: A thorough analysis of Universal Music Group N.V. (UMGAS)'s financials.
- Interactive Dashboard: Dynamically visualize valuation outcomes and forecasts.
Disclaimer
All information, articles, and product details provided on this website are for general informational and educational purposes only. We do not claim any ownership over, nor do we intend to infringe upon, any trademarks, copyrights, logos, brand names, or other intellectual property mentioned or depicted on this site. Such intellectual property remains the property of its respective owners, and any references here are made solely for identification or informational purposes, without implying any affiliation, endorsement, or partnership.
We make no representations or warranties, express or implied, regarding the accuracy, completeness, or suitability of any content or products presented. Nothing on this website should be construed as legal, tax, investment, financial, medical, or other professional advice. In addition, no part of this site—including articles or product references—constitutes a solicitation, recommendation, endorsement, advertisement, or offer to buy or sell any securities, franchises, or other financial instruments, particularly in jurisdictions where such activity would be unlawful.
All content is of a general nature and may not address the specific circumstances of any individual or entity. It is not a substitute for professional advice or services. Any actions you take based on the information provided here are strictly at your own risk. You accept full responsibility for any decisions or outcomes arising from your use of this website and agree to release us from any liability in connection with your use of, or reliance upon, the content or products found herein.