
|
DCF -Bewertung der Uniti Group Inc. (Einheit) |
Fully Editable: Tailor To Your Needs In Excel Or Sheets
Professional Design: Trusted, Industry-Standard Templates
Investor-Approved Valuation Models
MAC/PC Compatible, Fully Unlocked
No Expertise Is Needed; Easy To Follow
Uniti Group Inc. (UNIT) Bundle
Verbessern Sie Ihre Anlagestrategie mit dem DCF -Taschenrechner der Uniti Group Inc. (Einheit)! Erforschen Sie die Finanzdaten von Real Uniti, passen Sie Wachstumsprojektionen und -kosten an und beachten Sie sofort, wie sich diese Änderungen auf den inneren Wert von Uniti Group Inc. (Einheit) auswirken.
What You Will Get
- Editable Excel Template: A fully customizable Excel-based DCF Calculator featuring pre-filled real UNIT financials.
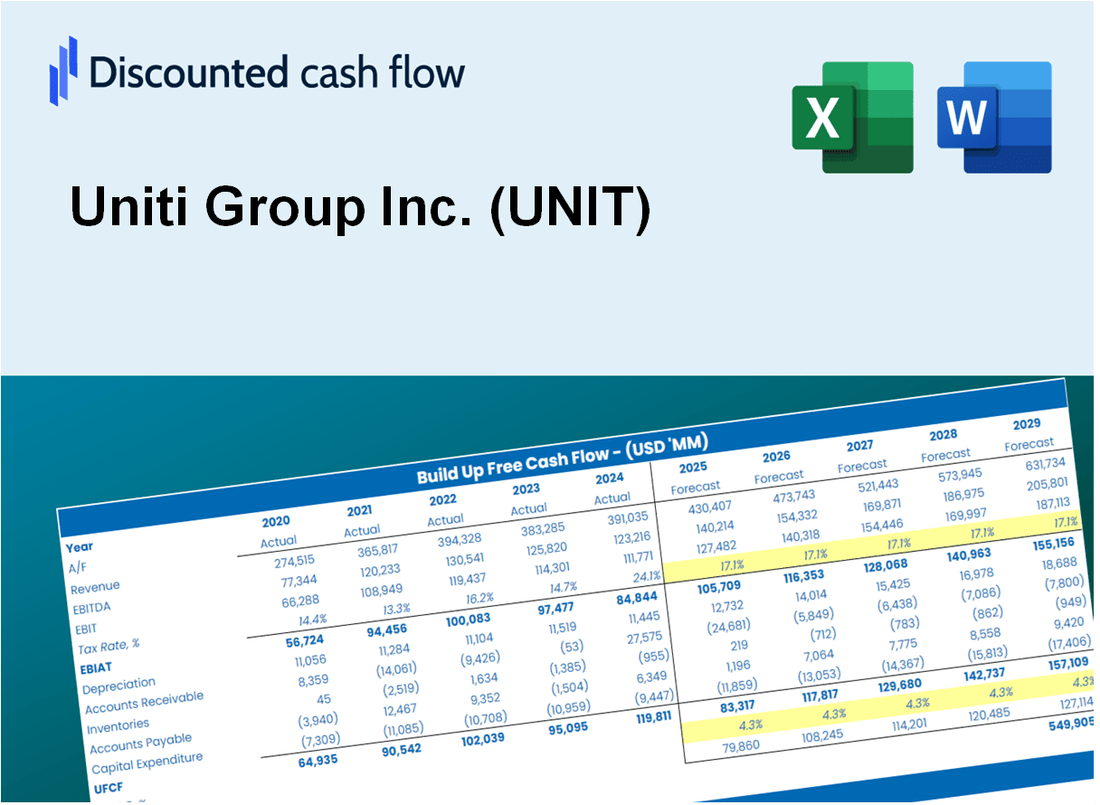
- Real-World Data: Historical data and forward-looking estimates (as indicated in the yellow cells).
- Forecast Flexibility: Adjust forecast assumptions such as revenue growth, EBITDA %, and WACC.
- Automatic Calculations: Quickly observe the effects of your inputs on Uniti Group Inc.'s valuation.
- Professional Tool: Designed for investors, CFOs, consultants, and financial analysts.
- User-Friendly Design: Organized for clarity and ease of use, complete with step-by-step instructions.
Key Features
- Comprehensive Uniti Financials: Gain access to precise pre-loaded historical data and future forecasts.
- Adjustable Forecast Parameters: Modify highlighted cells for WACC, growth rates, and profit margins.
- Real-Time Calculations: Automatic updates for DCF, Net Present Value (NPV), and cash flow assessments.
- Interactive Dashboard: User-friendly charts and summaries to help you visualize your valuation outcomes.
- Designed for All Levels: An intuitive layout suited for investors, CFOs, and consultants alike.
How It Works
- Step 1: Download the Excel file for Uniti Group Inc. (UNIT).
- Step 2: Examine the pre-filled financial data and forecasts for Uniti Group Inc. (UNIT).
- Step 3: Adjust key inputs such as revenue growth, WACC, and tax rates (highlighted cells).
- Step 4: Observe the DCF model refresh in real-time as you modify your assumptions.
- Step 5: Evaluate the outputs and leverage the results for your investment strategies.
Why Choose This Calculator for Uniti Group Inc. (UNIT)?
- Comprehensive Tool: Features DCF, WACC, and financial ratio analyses tailored for Uniti Group Inc. (UNIT).
- Customizable Inputs: Modify the yellow-highlighted cells to explore different investment scenarios.
- Detailed Insights: Automatically computes Uniti Group Inc. (UNIT)’s intrinsic value and Net Present Value.
- Preloaded Data: Access historical and projected data for accurate analysis starting points.
- Professional Quality: Perfect for financial analysts, investors, and business consultants focusing on Uniti Group Inc. (UNIT).
Who Should Use Uniti Group Inc. (UNIT)?
- Real Estate Investors: Gain insights into the unique opportunities in the telecommunications infrastructure sector.
- Financial Analysts: Utilize comprehensive data to evaluate Uniti Group's market position and performance.
- Consultants: Tailor analyses and presentations to showcase Uniti Group's growth potential to clients.
- Telecom Enthusiasts: Explore the intricacies of the telecom real estate investment trust (REIT) landscape.
- Educators and Students: Employ it as a case study in finance and investment courses focusing on REITs.
What the Template Contains
- Preloaded UNIT Data: Historical and projected financial data, including revenue, EBIT, and capital expenditures.
- DCF and WACC Models: Professional-grade sheets for calculating intrinsic value and Weighted Average Cost of Capital.
- Editable Inputs: Yellow-highlighted cells for adjusting revenue growth, tax rates, and discount rates.
- Financial Statements: Comprehensive annual and quarterly financials for deeper analysis.
- Key Ratios: Profitability, leverage, and efficiency ratios to evaluate performance.
- Dashboard and Charts: Visual summaries of valuation outcomes and assumptions.
Disclaimer
All information, articles, and product details provided on this website are for general informational and educational purposes only. We do not claim any ownership over, nor do we intend to infringe upon, any trademarks, copyrights, logos, brand names, or other intellectual property mentioned or depicted on this site. Such intellectual property remains the property of its respective owners, and any references here are made solely for identification or informational purposes, without implying any affiliation, endorsement, or partnership.
We make no representations or warranties, express or implied, regarding the accuracy, completeness, or suitability of any content or products presented. Nothing on this website should be construed as legal, tax, investment, financial, medical, or other professional advice. In addition, no part of this site—including articles or product references—constitutes a solicitation, recommendation, endorsement, advertisement, or offer to buy or sell any securities, franchises, or other financial instruments, particularly in jurisdictions where such activity would be unlawful.
All content is of a general nature and may not address the specific circumstances of any individual or entity. It is not a substitute for professional advice or services. Any actions you take based on the information provided here are strictly at your own risk. You accept full responsibility for any decisions or outcomes arising from your use of this website and agree to release us from any liability in connection with your use of, or reliance upon, the content or products found herein.