
|
UPL Limited (UPL.NS) DCF -Bewertung |
Fully Editable: Tailor To Your Needs In Excel Or Sheets
Professional Design: Trusted, Industry-Standard Templates
Investor-Approved Valuation Models
MAC/PC Compatible, Fully Unlocked
No Expertise Is Needed; Easy To Follow
UPL Limited (UPL.NS) Bundle
Möchten Sie den inneren Wert von UPL Limited bewerten? Unser UPLNS-DCF-Taschenrechner integriert reale Daten mit umfassenden Anpassungsfunktionen, sodass Sie Ihre Projektionen verfeinern und Ihre Investitionsentscheidungen verbessern können.
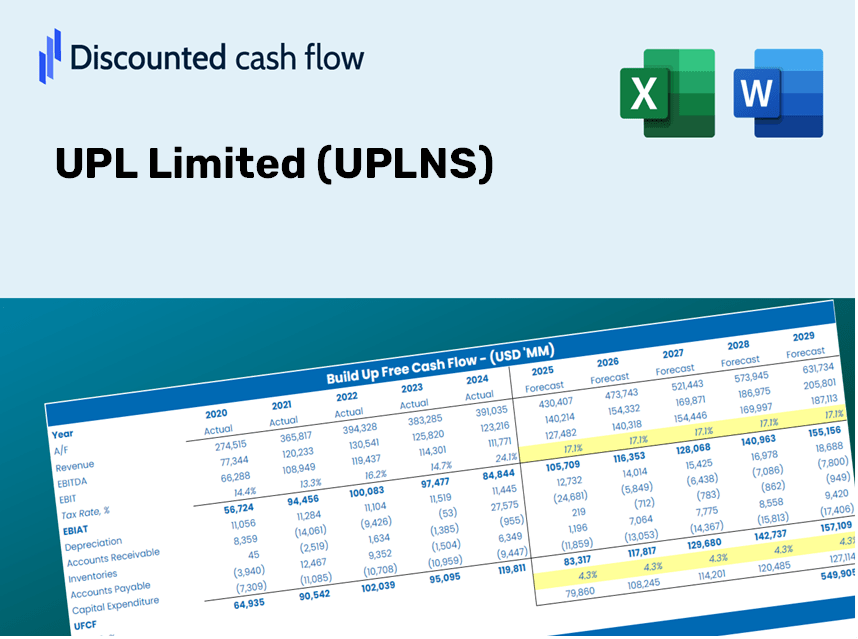
Discounted Cash Flow (DCF) - (USD MM)
| Year | AY1 2021 |
AY2 2022 |
AY3 2023 |
AY4 2024 |
AY5 2025 |
FY1 2026 |
FY2 2027 |
FY3 2028 |
FY4 2029 |
FY5 2030 |
|---|---|---|---|---|---|---|---|---|---|---|
| Revenue | 384,180.0 | 459,710.0 | 531,340.0 | 425,990.0 | 466,370.0 | 495,561.5 | 526,580.1 | 559,540.4 | 594,563.7 | 631,779.2 |
| Revenue Growth, % | 0 | 19.66 | 15.58 | -19.83 | 9.48 | 6.26 | 6.26 | 6.26 | 6.26 | 6.26 |
| EBITDA | 79,140.0 | 91,000.0 | 100,880.0 | 40,090.0 | 72,060.0 | 83,495.2 | 88,721.4 | 94,274.8 | 100,175.7 | 106,446.0 |
| EBITDA, % | 20.6 | 19.8 | 18.99 | 9.41 | 15.45 | 16.85 | 16.85 | 16.85 | 16.85 | 16.85 |
| Depreciation | 21,730.0 | 23,590.0 | 25,470.0 | 27,630.0 | 27,500.0 | 27,715.7 | 29,450.5 | 31,293.9 | 33,252.7 | 35,334.0 |
| Depreciation, % | 5.66 | 5.13 | 4.79 | 6.49 | 5.9 | 5.59 | 5.59 | 5.59 | 5.59 | 5.59 |
| EBIT | 57,410.0 | 67,410.0 | 75,410.0 | 12,460.0 | 44,560.0 | 55,779.5 | 59,270.9 | 62,980.9 | 66,923.0 | 71,112.0 |
| EBIT, % | 14.94 | 14.66 | 14.19 | 2.92 | 9.55 | 11.26 | 11.26 | 11.26 | 11.26 | 11.26 |
| Total Cash | 48,670.0 | 69,470.0 | 61,730.0 | 63,560.0 | 98,200.0 | 74,705.7 | 79,381.8 | 84,350.5 | 89,630.3 | 95,240.5 |
| Total Cash, percent | .0 | .0 | .0 | .0 | .0 | .0 | .0 | .0 | .0 | .0 |
| Account Receivables | 144,100.0 | 153,280.0 | 206,870.0 | 188,890.0 | 155,300.0 | 185,762.2 | 197,389.6 | 209,744.8 | 222,873.4 | 236,823.7 |
| Account Receivables, % | 37.51 | 33.34 | 38.93 | 44.34 | 33.3 | 37.49 | 37.49 | 37.49 | 37.49 | 37.49 |
| Inventories | 94,220.0 | 130,780.0 | 139,850.0 | 127,760.0 | 103,160.0 | 130,238.2 | 138,390.2 | 147,052.4 | 156,256.9 | 166,037.5 |
| Inventories, % | 24.52 | 28.45 | 26.32 | 29.99 | 22.12 | 26.28 | 26.28 | 26.28 | 26.28 | 26.28 |
| Accounts Payable | 127,590.0 | 165,520.0 | 176,140.0 | 156,840.0 | 146,480.0 | 169,078.4 | 179,661.5 | 190,907.1 | 202,856.5 | 215,553.9 |
| Accounts Payable, % | 33.21 | 36.01 | 33.15 | 36.82 | 31.41 | 34.12 | 34.12 | 34.12 | 34.12 | 34.12 |
| Capital Expenditure | -21,220.0 | -26,880.0 | -23,600.0 | -11,590.0 | -16,950.0 | -21,970.6 | -23,345.8 | -24,807.1 | -26,359.9 | -28,009.8 |
| Capital Expenditure, % | -5.52 | -5.85 | -4.44 | -2.72 | -3.63 | -4.43 | -4.43 | -4.43 | -4.43 | -4.43 |
| Tax Rate, % | -8.2 | -8.2 | -8.2 | -8.2 | -8.2 | -8.2 | -8.2 | -8.2 | -8.2 | -8.2 |
| EBITAT | 39,422.2 | 49,220.4 | 52,274.5 | 7,164.4 | 48,215.1 | 41,109.9 | 43,683.1 | 46,417.4 | 49,322.8 | 52,410.0 |
| Depreciation | ||||||||||
| Changes in Account Receivables | ||||||||||
| Changes in Inventories | ||||||||||
| Changes in Accounts Payable | ||||||||||
| Capital Expenditure | ||||||||||
| UFCF | -70,797.8 | 38,120.4 | 2,104.5 | 33,974.4 | 106,595.1 | 11,913.0 | 40,591.5 | 43,132.2 | 45,832.0 | 48,700.8 |
| WACC, % | 7.44 | 7.62 | 7.46 | 6.97 | 8.75 | 7.65 | 7.65 | 7.65 | 7.65 | 7.65 |
| PV UFCF | ||||||||||
| SUM PV UFCF | 148,491.0 | |||||||||
| Long Term Growth Rate, % | 2.00 | |||||||||
| Free cash flow (T + 1) | 49,675 | |||||||||
| Terminal Value | 879,443 | |||||||||
| Present Terminal Value | 608,372 | |||||||||
| Enterprise Value | 756,863 | |||||||||
| Net Debt | 156,210 | |||||||||
| Equity Value | 600,653 | |||||||||
| Diluted Shares Outstanding, MM | 854 | |||||||||
| Equity Value Per Share | 703.66 |
What You Will Receive
- Customizable Excel Template: A fully editable Excel-based DCF Calculator featuring pre-loaded financial data for UPL Limited (UPLNS).
- Authentic Data: Access to historical figures and future projections (illustrated in the highlighted cells).
- Adjustable Forecasts: Modify assumptions for revenue growth, EBITDA percentage, and WACC as needed.
- Instant Calculations: Quickly observe how your inputs affect UPL Limited’s (UPLNS) valuation.
- Professional Resource: Designed for investors, CFOs, consultants, and financial analysts.
- Intuitive Layout: Organized for simplicity and ease of navigation, complete with step-by-step guidance.
Key Features
- Customizable Forecast Inputs: Adjust essential parameters such as revenue growth, EBITDA %, and capital expenditures tailored for UPL Limited (UPLNS).
- Instant DCF Valuation: Automatically computes intrinsic value, NPV, and additional financial metrics on demand.
- High-Precision Accuracy: Leverages UPL Limited's (UPLNS) actual financial data for credible valuation results.
- Effortless Scenario Analysis: Easily evaluate various assumptions and compare results for informed decision-making.
- Efficiency Booster: Streamline your valuation process without the hassle of constructing intricate models from the ground up.
How It Functions
- Download: Obtain the pre-configured Excel file containing UPL Limited’s (UPLNS) financial data.
- Customize: Modify your forecasts, including revenue growth, EBITDA %, and WACC.
- Update Automatically: Watch as the intrinsic value and NPV calculations refresh in real-time.
- Test Scenarios: Generate various projections and analyze results instantly.
- Make Decisions: Leverage the valuation findings to inform your investment approach.
Why Opt for This Calculator?
- User-Friendly and Intuitive: Tailored for both novices and seasoned professionals.
- Customizable Inputs: Easily adjust parameters to suit your analysis needs.
- Real-Time Updates: Instantly observe how UPL Limited’s valuation changes as you modify inputs.
- Pre-Configured: Comes with UPL Limited’s actual financial data for swift analysis.
- Preferred by Experts: Utilized by investors and analysts for well-informed decision-making.
Who Can Benefit from This Product?
- Institutional Investors: Develop comprehensive and accurate valuation models for portfolio evaluations.
- Corporate Finance Departments: Assess valuation scenarios to inform strategic planning within the organization.
- Financial Consultants and Advisors: Deliver precise valuation insights for UPL Limited (UPLNS) to your clients.
- Students and Teachers: Utilize real-world data to enhance learning and practice in financial modeling.
- Market Analysts: Gain insights into the valuation methods used for companies like UPL Limited (UPLNS).
Contents of the Template
- Preloaded UPL Limited Data: Historical and forecasted financial metrics, encompassing revenue, EBIT, and capital expenditures.
- DCF and WACC Models: High-quality spreadsheets designed for calculating intrinsic value and Weighted Average Cost of Capital.
- Editable Inputs: Yellow-highlighted cells for customizing revenue growth, tax rates, and discount rates.
- Financial Statements: Detailed annual and quarterly financial reports for in-depth analysis.
- Key Ratios: Measures of profitability, leverage, and efficiency to assess performance.
- Dashboard and Charts: Visual representations of valuation results and underlying assumptions.
Disclaimer
All information, articles, and product details provided on this website are for general informational and educational purposes only. We do not claim any ownership over, nor do we intend to infringe upon, any trademarks, copyrights, logos, brand names, or other intellectual property mentioned or depicted on this site. Such intellectual property remains the property of its respective owners, and any references here are made solely for identification or informational purposes, without implying any affiliation, endorsement, or partnership.
We make no representations or warranties, express or implied, regarding the accuracy, completeness, or suitability of any content or products presented. Nothing on this website should be construed as legal, tax, investment, financial, medical, or other professional advice. In addition, no part of this site—including articles or product references—constitutes a solicitation, recommendation, endorsement, advertisement, or offer to buy or sell any securities, franchises, or other financial instruments, particularly in jurisdictions where such activity would be unlawful.
All content is of a general nature and may not address the specific circumstances of any individual or entity. It is not a substitute for professional advice or services. Any actions you take based on the information provided here are strictly at your own risk. You accept full responsibility for any decisions or outcomes arising from your use of this website and agree to release us from any liability in connection with your use of, or reliance upon, the content or products found herein.