
|
Upwork Inc. (UPWK) DCF -Bewertung |
Fully Editable: Tailor To Your Needs In Excel Or Sheets
Professional Design: Trusted, Industry-Standard Templates
Investor-Approved Valuation Models
MAC/PC Compatible, Fully Unlocked
No Expertise Is Needed; Easy To Follow
Upwork Inc. (UPWK) Bundle
Möchten Sie den inneren Wert von Upwork Inc. bestimmen? Unser UPWK-DCF-Taschenrechner integriert reale Daten mit umfangreichen Anpassungsfunktionen, sodass Sie Ihre Projektionen verfeinern und fundiertere Investitionsentscheidungen treffen können.
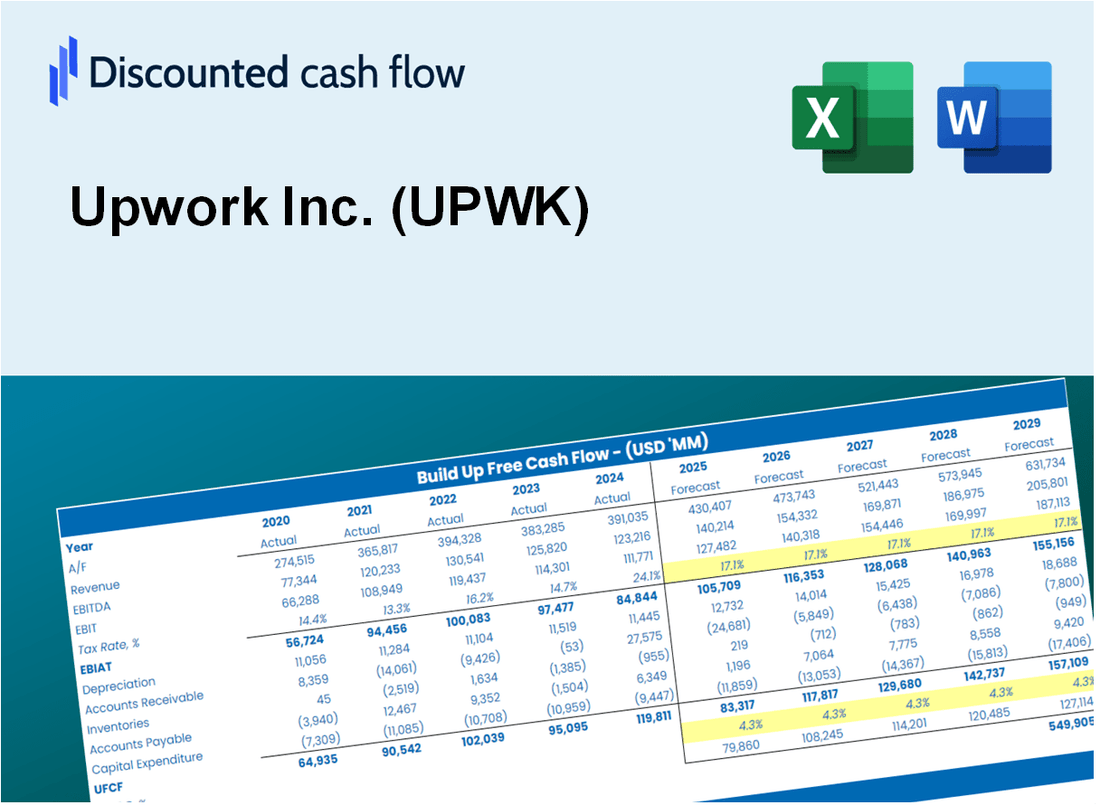
Discounted Cash Flow (DCF) - (USD MM)
| Year | AY1 2020 |
AY2 2021 |
AY3 2022 |
AY4 2023 |
AY5 2024 |
FY1 2025 |
FY2 2026 |
FY3 2027 |
FY4 2028 |
FY5 2029 |
|---|---|---|---|---|---|---|---|---|---|---|
| Revenue | 373.6 | 502.8 | 618.3 | 689.1 | 769.3 | 924.4 | 1,110.8 | 1,334.7 | 1,603.8 | 1,927.1 |
| Revenue Growth, % | 0 | 34.57 | 22.98 | 11.45 | 11.64 | 20.16 | 20.16 | 20.16 | 20.16 | 20.16 |
| EBITDA | -7.9 | -40.1 | -81.5 | 1.5 | 82.9 | -22.7 | -27.3 | -32.8 | -39.4 | -47.4 |
| EBITDA, % | -2.12 | -7.98 | -13.18 | 0.21157 | 10.77 | -2.46 | -2.46 | -2.46 | -2.46 | -2.46 |
| Depreciation | 14.0 | 13.8 | 11.1 | 12.7 | 17.7 | 23.0 | 27.6 | 33.2 | 39.9 | 48.0 |
| Depreciation, % | 3.76 | 2.75 | 1.8 | 1.85 | 2.29 | 2.49 | 2.49 | 2.49 | 2.49 | 2.49 |
| EBIT | -21.9 | -53.9 | -92.6 | -11.3 | 65.2 | -45.7 | -55.0 | -66.0 | -79.3 | -95.3 |
| EBIT, % | -5.87 | -10.73 | -14.98 | -1.63 | 8.48 | -4.95 | -4.95 | -4.95 | -4.95 | -4.95 |
| Total Cash | 169.7 | 684.8 | 686.6 | 550.1 | 622.1 | 750.8 | 902.2 | 1,084.0 | 1,302.5 | 1,565.1 |
| Total Cash, percent | .0 | .0 | .0 | .0 | .0 | .0 | .0 | .0 | .0 | .0 |
| Account Receivables | 47.0 | 66.8 | 64.9 | 103.1 | 75.5 | 113.0 | 135.8 | 163.2 | 196.1 | 235.6 |
| Account Receivables, % | 12.58 | 13.29 | 10.49 | 14.96 | 9.81 | 12.23 | 12.23 | 12.23 | 12.23 | 12.23 |
| Inventories | .0 | .0 | 161.5 | .0 | .0 | 48.3 | 58.0 | 69.7 | 83.8 | 100.6 |
| Inventories, % | 0 | 0 | 26.11 | 0 | 0 | 5.22 | 5.22 | 5.22 | 5.22 | 5.22 |
| Accounts Payable | 6.5 | 5.0 | 7.5 | 5.1 | 6.1 | 10.1 | 12.2 | 14.6 | 17.6 | 21.1 |
| Accounts Payable, % | 1.73 | 0.99364 | 1.22 | 0.73469 | 0.79654 | 1.09 | 1.09 | 1.09 | 1.09 | 1.09 |
| Capital Expenditure | -14.4 | -6.1 | -8.7 | -16.4 | -3.5 | -17.2 | -20.7 | -24.8 | -29.9 | -35.9 |
| Capital Expenditure, % | -3.84 | -1.22 | -1.41 | -2.37 | -0.45858 | -1.86 | -1.86 | -1.86 | -1.86 | -1.86 |
| Tax Rate, % | -138.41 | -138.41 | -138.41 | -138.41 | -138.41 | -138.41 | -138.41 | -138.41 | -138.41 | -138.41 |
| EBITAT | -22.1 | -54.1 | -93.2 | -10.8 | 155.5 | -45.4 | -54.5 | -65.5 | -78.7 | -94.6 |
| Depreciation | ||||||||||
| Changes in Account Receivables | ||||||||||
| Changes in Inventories | ||||||||||
| Changes in Accounts Payable | ||||||||||
| Capital Expenditure | ||||||||||
| UFCF | -63.0 | -67.7 | -247.7 | 106.4 | 198.2 | -121.4 | -78.0 | -93.8 | -112.7 | -135.4 |
| WACC, % | 9.98 | 9.98 | 9.98 | 9.96 | 9.98 | 9.98 | 9.98 | 9.98 | 9.98 | 9.98 |
| PV UFCF | ||||||||||
| SUM PV UFCF | -406.5 | |||||||||
| Long Term Growth Rate, % | 2.00 | |||||||||
| Free cash flow (T + 1) | -138 | |||||||||
| Terminal Value | -1,731 | |||||||||
| Present Terminal Value | -1,076 | |||||||||
| Enterprise Value | -1,482 | |||||||||
| Net Debt | 63 | |||||||||
| Equity Value | -1,545 | |||||||||
| Diluted Shares Outstanding, MM | 143 | |||||||||
| Equity Value Per Share | -10.80 |
What You Will Get
- Real UPWK Financials: Access to historical and projected data for precise valuation.
- Customizable Inputs: Adjust WACC, tax rates, revenue growth, and capital expenditures as needed.
- Dynamic Calculations: Intrinsic value and NPV are computed automatically.
- Scenario Analysis: Evaluate various scenarios to assess Upwork’s future performance.
- User-Friendly Design: Designed for professionals but easy for beginners to navigate.
Key Features
- Comprehensive Project Marketplace: Access a vast pool of freelancers and projects tailored to your needs.
- Flexible Work Arrangements: Customize your hiring process and project timelines to suit your workflow.
- Real-Time Collaboration Tools: Utilize integrated communication features for seamless project management.
- Performance Tracking: Monitor freelancer performance and project progress with detailed analytics.
- Designed for All Users: User-friendly interface suitable for businesses, freelancers, and agencies alike.
How It Works
- Download: Get the pre-prepared Excel file featuring Upwork Inc.'s (UPWK) financial data.
- Customize: Modify projections, including user growth, revenue forecasts, and profit margins.
- Update Automatically: The intrinsic value and NPV metrics refresh in real-time.
- Test Scenarios: Develop various projections and analyze results immediately.
- Make Decisions: Leverage the valuation findings to inform your investment choices.
Why Choose This Upwork Calculator?
- Accuracy: Real Upwork financials ensure data accuracy.
- Flexibility: Designed for users to test and modify inputs freely.
- Time-Saving: Skip the hassle of creating a financial model from scratch.
- Professional-Grade: Developed with CFO-level precision and usability in mind.
- User-Friendly: Easy to use, even for those without advanced financial modeling experience.
Who Should Use Upwork Inc. (UPWK)?
- Freelancers: Discover new job opportunities and connect with clients seeking your skills.
- Businesses: Find talented professionals to help with projects and scale your team efficiently.
- Entrepreneurs: Leverage Upwork to access a diverse pool of freelancers for your startup needs.
- Project Managers: Manage projects effectively with a wide range of freelance experts at your fingertips.
- Recruiters: Utilize Upwork to source and evaluate candidates for temporary or contract roles.
What the Template Contains
- Pre-Filled Data: Includes Upwork Inc.'s (UPWK) historical financials and forecasts.
- Discounted Cash Flow Model: Editable DCF valuation model with automatic calculations.
- Weighted Average Cost of Capital (WACC): A dedicated sheet for calculating WACC based on custom inputs.
- Key Financial Ratios: Analyze Upwork Inc.'s (UPWK) profitability, efficiency, and leverage.
- Customizable Inputs: Edit revenue growth, margins, and tax rates with ease.
- Clear Dashboard: Charts and tables summarizing key valuation results.
Disclaimer
All information, articles, and product details provided on this website are for general informational and educational purposes only. We do not claim any ownership over, nor do we intend to infringe upon, any trademarks, copyrights, logos, brand names, or other intellectual property mentioned or depicted on this site. Such intellectual property remains the property of its respective owners, and any references here are made solely for identification or informational purposes, without implying any affiliation, endorsement, or partnership.
We make no representations or warranties, express or implied, regarding the accuracy, completeness, or suitability of any content or products presented. Nothing on this website should be construed as legal, tax, investment, financial, medical, or other professional advice. In addition, no part of this site—including articles or product references—constitutes a solicitation, recommendation, endorsement, advertisement, or offer to buy or sell any securities, franchises, or other financial instruments, particularly in jurisdictions where such activity would be unlawful.
All content is of a general nature and may not address the specific circumstances of any individual or entity. It is not a substitute for professional advice or services. Any actions you take based on the information provided here are strictly at your own risk. You accept full responsibility for any decisions or outcomes arising from your use of this website and agree to release us from any liability in connection with your use of, or reliance upon, the content or products found herein.