
|
USCB Financial Holdings, Inc. (USCB) DCF -Bewertung |
Fully Editable: Tailor To Your Needs In Excel Or Sheets
Professional Design: Trusted, Industry-Standard Templates
Investor-Approved Valuation Models
MAC/PC Compatible, Fully Unlocked
No Expertise Is Needed; Easy To Follow
USCB Financial Holdings, Inc. (USCB) Bundle
Entdecken Sie die finanziellen Aussichten von USCB Financial Holdings, Inc. (USCB) mit unserem benutzerfreundlichen DCF-Taschenrechner! Geben Sie Ihre Prognosen für Wachstum, Margen und Kosten ein, um den inneren Wert von USCB zu berechnen und Ihren Investitionsansatz zu verfeinern.
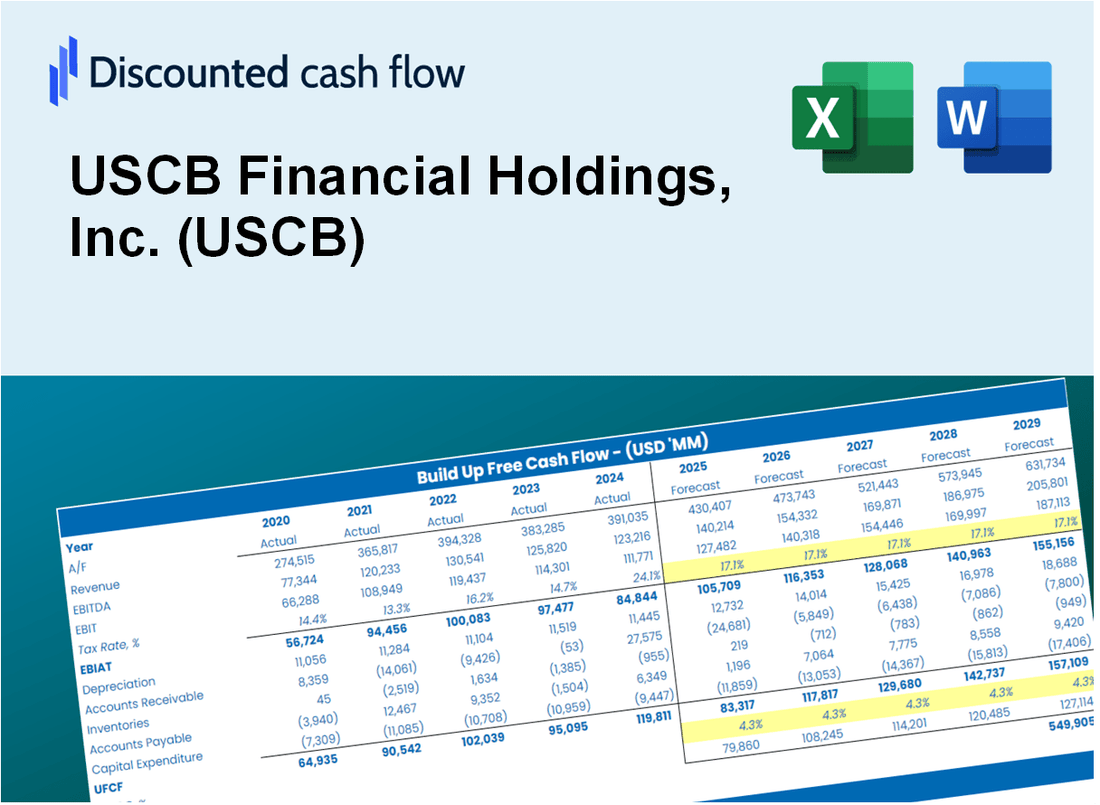
Discounted Cash Flow (DCF) - (USD MM)
| Year | AY1 2020 |
AY2 2021 |
AY3 2022 |
AY4 2023 |
AY5 2024 |
FY1 2025 |
FY2 2026 |
FY3 2027 |
FY4 2028 |
FY5 2029 |
|---|---|---|---|---|---|---|---|---|---|---|
| Revenue | 58.7 | 63.9 | 76.2 | 108.4 | 144.0 | 181.1 | 227.8 | 286.5 | 360.4 | 453.3 |
| Revenue Growth, % | 0 | 8.87 | 19.13 | 42.35 | 32.79 | 25.78 | 25.78 | 25.78 | 25.78 | 25.78 |
| EBITDA | 14.7 | 28.7 | 27.8 | 22.4 | 33.1 | 54.3 | 68.3 | 85.9 | 108.1 | 136.0 |
| EBITDA, % | 25 | 44.9 | 36.46 | 20.65 | 22.97 | 30 | 30 | 30 | 30 | 30 |
| Depreciation | 1.3 | 1.0 | .7 | .6 | .6 | 2.0 | 2.6 | 3.2 | 4.1 | 5.1 |
| Depreciation, % | 2.17 | 1.62 | 0.90328 | 0.54418 | 0.40772 | 1.13 | 1.13 | 1.13 | 1.13 | 1.13 |
| EBIT | 13.4 | 27.7 | 27.1 | 21.8 | 32.5 | 52.3 | 65.8 | 82.7 | 104.0 | 130.9 |
| EBIT, % | 22.83 | 43.29 | 35.56 | 20.1 | 22.56 | 28.87 | 28.87 | 28.87 | 28.87 | 28.87 |
| Total Cash | 47.7 | 46.2 | 54.2 | 270.4 | 294.2 | 153.8 | 193.5 | 243.4 | 306.1 | 385.0 |
| Total Cash, percent | .0 | .0 | .0 | .0 | .0 | .0 | .0 | .0 | .0 | .0 |
| Account Receivables | 5.5 | 6.0 | 7.5 | 10.7 | 10.9 | 16.7 | 21.0 | 26.4 | 33.3 | 41.8 |
| Account Receivables, % | 9.44 | 9.35 | 9.91 | 9.86 | 7.6 | 9.23 | 9.23 | 9.23 | 9.23 | 9.23 |
| Inventories | .0 | .0 | .0 | .0 | .0 | .0 | .0 | .0 | .0 | .0 |
| Inventories, % | 0 | 0 | 0 | 0 | 0 | 0 | 0 | 0 | 0 | 0 |
| Accounts Payable | 6.8 | 9.5 | 13.7 | 15.6 | 20.4 | 26.4 | 33.2 | 41.8 | 52.6 | 66.2 |
| Accounts Payable, % | 11.62 | 14.82 | 18.03 | 14.35 | 14.15 | 14.6 | 14.6 | 14.6 | 14.6 | 14.6 |
| Capital Expenditure | -.3 | -.6 | -.7 | -.2 | -.3 | -1.0 | -1.3 | -1.6 | -2.0 | -2.6 |
| Capital Expenditure, % | -0.59084 | -0.99004 | -0.88358 | -0.15034 | -0.2181 | -0.56658 | -0.56658 | -0.56658 | -0.56658 | -0.56658 |
| Tax Rate, % | 24.03 | 24.03 | 24.03 | 24.03 | 24.03 | 24.03 | 24.03 | 24.03 | 24.03 | 24.03 |
| EBITAT | 10.8 | 21.1 | 20.1 | 16.5 | 24.7 | 40.1 | 50.4 | 63.4 | 79.7 | 100.3 |
| Depreciation | ||||||||||
| Changes in Account Receivables | ||||||||||
| Changes in Inventories | ||||||||||
| Changes in Accounts Payable | ||||||||||
| Capital Expenditure | ||||||||||
| UFCF | 13.0 | 23.7 | 22.8 | 15.7 | 29.5 | 41.4 | 54.2 | 68.1 | 85.7 | 107.8 |
| WACC, % | 13.88 | 13.34 | 13.13 | 13.32 | 13.32 | 13.4 | 13.4 | 13.4 | 13.4 | 13.4 |
| PV UFCF | ||||||||||
| SUM PV UFCF | 234.6 | |||||||||
| Long Term Growth Rate, % | 2.00 | |||||||||
| Free cash flow (T + 1) | 110 | |||||||||
| Terminal Value | 964 | |||||||||
| Present Terminal Value | 514 | |||||||||
| Enterprise Value | 749 | |||||||||
| Net Debt | 94 | |||||||||
| Equity Value | 655 | |||||||||
| Diluted Shares Outstanding, MM | 20 | |||||||||
| Equity Value Per Share | 33.01 |
What You Will Get
- Editable Excel Template: A fully customizable Excel-based DCF Calculator featuring pre-filled real USCB financials.
- Real-World Data: Historical data and forward-looking estimates (highlighted in the yellow cells).
- Forecast Flexibility: Adjust forecast assumptions such as revenue growth, EBITDA %, and WACC.
- Automatic Calculations: Instantly observe how your inputs affect USCB’s valuation.
- Professional Tool: Designed for investors, CFOs, consultants, and financial analysts.
- User-Friendly Design: Organized for clarity and ease of use, complete with step-by-step instructions.
Key Features
- Comprehensive DCF Calculator: Offers detailed unlevered and levered DCF valuation models tailored for USCB Financial Holdings, Inc. (USCB).
- WACC Calculator: Features a pre-built Weighted Average Cost of Capital sheet with adjustable inputs for accurate financial analysis.
- Customizable Forecast Assumptions: Easily modify growth rates, capital expenditures, and discount rates to fit your analysis needs.
- Integrated Financial Ratios: Assess profitability, leverage, and efficiency ratios specifically for USCB Financial Holdings, Inc. (USCB).
- Interactive Dashboard and Charts: Visual representations that summarize essential valuation metrics for straightforward analysis.
How It Works
- Step 1: Download the Excel file for USCB Financial Holdings, Inc. (USCB).
- Step 2: Review USCB's pre-filled financial data and forecasts.
- Step 3: Modify key inputs such as revenue growth, WACC, and tax rates (highlighted cells).
- Step 4: Observe the DCF model update in real-time as you adjust your assumptions.
- Step 5: Analyze the outputs and leverage the results for your investment decisions.
Why Choose USCB Financial Holdings, Inc. (USCB)?
- Accuracy: Utilizes real USCB financial data to ensure precise calculations.
- Flexibility: Tailored for users to easily adjust and test various inputs.
- Time-Saving: Eliminate the need to create a financial model from the ground up.
- Professional-Grade: Crafted with the expertise and usability expected at the CFO level.
- User-Friendly: Intuitive design makes it accessible for users without extensive financial modeling skills.
Who Should Use This Product?
- Institutional Investors: Develop comprehensive and accurate valuation models for investment analysis in USCB (USCB).
- Corporate Finance Departments: Evaluate valuation scenarios to inform strategic decisions within the organization.
- Financial Consultants: Deliver precise valuation insights to clients regarding USCB (USCB) stock.
- Academics and Learners: Utilize real-time data to enhance skills in financial modeling and analysis.
- Market Analysts: Gain insights into how financial institutions like USCB (USCB) are assessed in the market.
What the Template Contains
- Preloaded USCB Data: Historical and projected financial data, including revenue, EBIT, and capital expenditures.
- DCF and WACC Models: Professional-grade sheets for calculating intrinsic value and Weighted Average Cost of Capital.
- Editable Inputs: Yellow-highlighted cells for adjusting revenue growth, tax rates, and discount rates.
- Financial Statements: Comprehensive annual and quarterly financials for deeper analysis.
- Key Ratios: Profitability, leverage, and efficiency ratios to evaluate performance.
- Dashboard and Charts: Visual summaries of valuation outcomes and assumptions.
Disclaimer
All information, articles, and product details provided on this website are for general informational and educational purposes only. We do not claim any ownership over, nor do we intend to infringe upon, any trademarks, copyrights, logos, brand names, or other intellectual property mentioned or depicted on this site. Such intellectual property remains the property of its respective owners, and any references here are made solely for identification or informational purposes, without implying any affiliation, endorsement, or partnership.
We make no representations or warranties, express or implied, regarding the accuracy, completeness, or suitability of any content or products presented. Nothing on this website should be construed as legal, tax, investment, financial, medical, or other professional advice. In addition, no part of this site—including articles or product references—constitutes a solicitation, recommendation, endorsement, advertisement, or offer to buy or sell any securities, franchises, or other financial instruments, particularly in jurisdictions where such activity would be unlawful.
All content is of a general nature and may not address the specific circumstances of any individual or entity. It is not a substitute for professional advice or services. Any actions you take based on the information provided here are strictly at your own risk. You accept full responsibility for any decisions or outcomes arising from your use of this website and agree to release us from any liability in connection with your use of, or reliance upon, the content or products found herein.