
|
USD Partners LP (USDP) DCF -Bewertung |
Fully Editable: Tailor To Your Needs In Excel Or Sheets
Professional Design: Trusted, Industry-Standard Templates
Investor-Approved Valuation Models
MAC/PC Compatible, Fully Unlocked
No Expertise Is Needed; Easy To Follow
USD Partners LP (USDP) Bundle
Entdecken Sie die finanziellen Aussichten von USD Partners LP (USDP) mit unserem benutzerfreundlichen DCF-Taschenrechner! Geben Sie Ihre Projektionen für Wachstum, Margen und Ausgaben ein, um den inneren Wert von USD Partners LP (USDP) zu berechnen und Ihre Anlageentscheidungen zu verbessern.
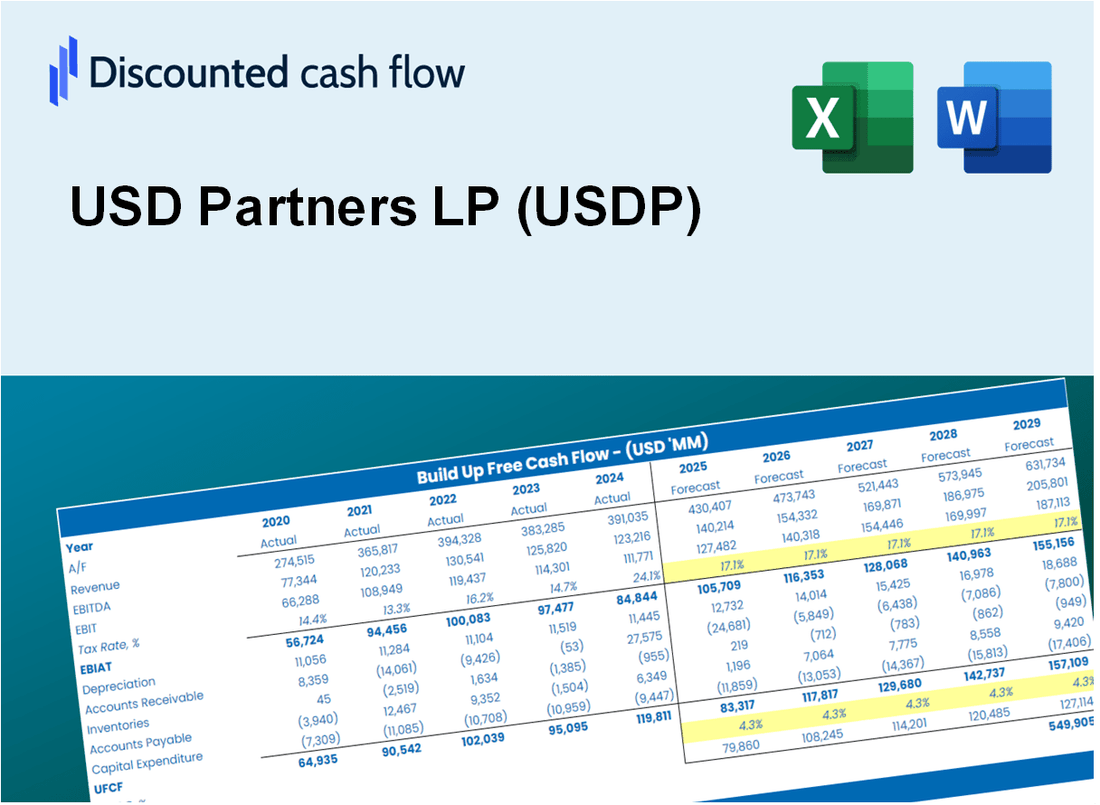
Discounted Cash Flow (DCF) - (USD MM)
| Year | AY1 2020 |
AY2 2021 |
AY3 2022 |
AY4 2023 |
AY5 2024 |
FY1 2025 |
FY2 2026 |
FY3 2027 |
FY4 2028 |
FY5 2029 |
|---|---|---|---|---|---|---|---|---|---|---|
| Revenue | 120.0 | 122.1 | 111.7 | 62.9 | 35.8 | 27.5 | 21.0 | 16.1 | 12.3 | 9.5 |
| Revenue Growth, % | 0 | 1.71 | -8.55 | -43.7 | -42.99 | -23.38 | -23.38 | -23.38 | -23.38 | -23.38 |
| EBITDA | 10.9 | 53.9 | -29.7 | 47.2 | -14.9 | 3.3 | 2.5 | 1.9 | 1.5 | 1.1 |
| EBITDA, % | 9.09 | 44.16 | -26.58 | 75.04 | -41.72 | 12 | 12 | 12 | 12 | 12 |
| Depreciation | 22.5 | 23.2 | 19.6 | 6.2 | 2.4 | 3.9 | 3.0 | 2.3 | 1.8 | 1.4 |
| Depreciation, % | 18.73 | 18.97 | 17.59 | 9.87 | 6.71 | 14.37 | 14.37 | 14.37 | 14.37 | 14.37 |
| EBIT | -11.6 | 30.8 | -49.3 | 41.0 | -17.4 | -.7 | -.5 | -.4 | -.3 | -.2 |
| EBIT, % | -9.64 | 25.19 | -44.17 | 65.17 | -48.43 | -2.38 | -2.38 | -2.38 | -2.38 | -2.38 |
| Total Cash | 3.0 | 3.7 | 2.5 | 10.4 | 8.2 | 2.6 | 2.0 | 1.5 | 1.2 | .9 |
| Total Cash, percent | .0 | .0 | .0 | .0 | .0 | .0 | .0 | .0 | .0 | .0 |
| Account Receivables | 6.5 | 8.8 | 2.6 | 1.6 | 1.6 | 1.2 | .9 | .7 | .5 | .4 |
| Account Receivables, % | 5.42 | 7.22 | 2.31 | 2.5 | 4.56 | 4.4 | 4.4 | 4.4 | 4.4 | 4.4 |
| Inventories | .0 | 3.0 | .0 | 1.6 | .0 | .3 | .2 | .2 | .1 | .1 |
| Inventories, % | 0 | 2.48 | 0 | 2.48 | 0 | 0.99187 | 0.99187 | 0.99187 | 0.99187 | 0.99187 |
| Accounts Payable | 2.2 | 21.8 | 4.5 | 2.3 | 5.1 | 2.3 | 1.8 | 1.3 | 1.0 | .8 |
| Accounts Payable, % | 1.87 | 17.88 | 4.06 | 3.71 | 14.18 | 8.34 | 8.34 | 8.34 | 8.34 | 8.34 |
| Capital Expenditure | -.5 | -2.4 | -.5 | -.6 | .0 | -.2 | -.2 | -.1 | -.1 | -.1 |
| Capital Expenditure, % | -0.40319 | -1.96 | -0.41915 | -1.03 | 0 | -0.76197 | -0.76197 | -0.76197 | -0.76197 | -0.76197 |
| Tax Rate, % | -0.38936 | -0.38936 | -0.38936 | -0.38936 | -0.38936 | -0.38936 | -0.38936 | -0.38936 | -0.38936 | -0.38936 |
| EBITAT | -11.5 | 31.7 | -50.4 | 38.7 | -17.4 | -.6 | -.5 | -.4 | -.3 | -.2 |
| Depreciation | ||||||||||
| Changes in Account Receivables | ||||||||||
| Changes in Inventories | ||||||||||
| Changes in Accounts Payable | ||||||||||
| Capital Expenditure | ||||||||||
| UFCF | 6.2 | 66.7 | -39.2 | 41.5 | -10.8 | .5 | 2.2 | 1.7 | 1.3 | 1.0 |
| WACC, % | 19.06 | 19.09 | 19.09 | 18.02 | 19.09 | 18.87 | 18.87 | 18.87 | 18.87 | 18.87 |
| PV UFCF | ||||||||||
| SUM PV UFCF | 4.0 | |||||||||
| Long Term Growth Rate, % | 2.00 | |||||||||
| Free cash flow (T + 1) | 1 | |||||||||
| Terminal Value | 6 | |||||||||
| Present Terminal Value | 2 | |||||||||
| Enterprise Value | 6 | |||||||||
| Net Debt | 174 | |||||||||
| Equity Value | -167 | |||||||||
| Diluted Shares Outstanding, MM | 34 | |||||||||
| Equity Value Per Share | -4.95 |
What You Will Gain
- Comprehensive Financial Model: Utilize USD Partners LP’s actual data for accurate DCF valuation.
- Complete Forecast Flexibility: Modify revenue growth, profit margins, WACC, and other essential variables.
- Real-Time Calculations: Automatic updates provide immediate insights as you adjust inputs.
- Professional-Grade Template: A polished Excel file crafted for high-quality valuation.
- Adaptable and Reusable: Designed for versatility, facilitating repeated use for in-depth forecasts.
Key Features
- Customizable Financial Metrics: Adjust vital inputs such as revenue projections, operating margins, and capital investments.
- Instant DCF Valuation: Quickly computes intrinsic value, net present value (NPV), and other financial metrics.
- High-Precision Analytics: Leverages USD Partners LP’s (USDP) actual financial data for accurate valuation results.
- Effortless Scenario Testing: Easily explore various assumptions and assess different outcomes.
- Efficiency Booster: Streamline the valuation process without the hassle of constructing intricate models from the ground up.
How It Works
- Download: Obtain the pre-built Excel file featuring USD Partners LP’s (USDP) financial data.
- Customize: Modify forecasts, such as revenue growth, EBITDA %, and WACC.
- Update Automatically: The intrinsic value and NPV calculations refresh in real-time.
- Test Scenarios: Generate various projections and compare results instantly.
- Make Decisions: Leverage the valuation findings to inform your investment strategy.
Why Choose USD Partners LP (USDP) Calculator?
- Save Time: Instantly access a comprehensive DCF model without starting from scratch.
- Enhance Accuracy: Utilize dependable financial data and formulas to minimize valuation errors.
- Fully Customizable: Adjust the model to align with your specific assumptions and forecasts.
- Easy to Understand: Intuitive charts and outputs simplify the analysis of results.
- Endorsed by Professionals: Crafted for industry experts who prioritize accuracy and functionality.
Who Should Use This Product?
- Investors: Evaluate USD Partners LP’s (USDP) valuation before making investment decisions.
- CFOs and Financial Analysts: Enhance valuation methodologies and assess financial forecasts for USDP.
- Startup Founders: Understand the valuation strategies of established companies like USD Partners LP.
- Consultants: Provide clients with detailed valuation analyses and reports for USDP.
- Students and Educators: Utilize real-time data from USD Partners LP to learn and teach valuation practices.
What the Template Contains
- Pre-Filled Data: Contains USD Partners LP’s historical financials and projections.
- Discounted Cash Flow Model: Editable DCF valuation model with automatic calculations.
- Weighted Average Cost of Capital (WACC): A dedicated sheet for calculating WACC based on custom inputs.
- Key Financial Ratios: Evaluate USD Partners LP’s profitability, efficiency, and leverage.
- Customizable Inputs: Easily adjust revenue growth, margins, and tax rates.
- Clear Dashboard: Visual representations and tables summarizing key valuation outcomes.
Disclaimer
All information, articles, and product details provided on this website are for general informational and educational purposes only. We do not claim any ownership over, nor do we intend to infringe upon, any trademarks, copyrights, logos, brand names, or other intellectual property mentioned or depicted on this site. Such intellectual property remains the property of its respective owners, and any references here are made solely for identification or informational purposes, without implying any affiliation, endorsement, or partnership.
We make no representations or warranties, express or implied, regarding the accuracy, completeness, or suitability of any content or products presented. Nothing on this website should be construed as legal, tax, investment, financial, medical, or other professional advice. In addition, no part of this site—including articles or product references—constitutes a solicitation, recommendation, endorsement, advertisement, or offer to buy or sell any securities, franchises, or other financial instruments, particularly in jurisdictions where such activity would be unlawful.
All content is of a general nature and may not address the specific circumstances of any individual or entity. It is not a substitute for professional advice or services. Any actions you take based on the information provided here are strictly at your own risk. You accept full responsibility for any decisions or outcomes arising from your use of this website and agree to release us from any liability in connection with your use of, or reliance upon, the content or products found herein.