
|
Energy Fuels Inc. (UUUU) DCF -Bewertung |
Fully Editable: Tailor To Your Needs In Excel Or Sheets
Professional Design: Trusted, Industry-Standard Templates
Investor-Approved Valuation Models
MAC/PC Compatible, Fully Unlocked
No Expertise Is Needed; Easy To Follow
Energy Fuels Inc. (UUUU) Bundle
Verbessern Sie Ihre Anlagestrategien mit dem DCF -Taschenrechner des Energy Fuels Inc. (UUUU)! Erforschen Sie authentische Finanzdaten, passen Sie Wachstumsprojektionen und -kosten an und beachten Sie sofort, wie sich diese Veränderungen auf den inneren Wert von Energy Fuels Inc. (UUUU) auswirken.
Discounted Cash Flow (DCF) - (USD MM)
| Year | AY1 2020 |
AY2 2021 |
AY3 2022 |
AY4 2023 |
AY5 2024 |
FY1 2025 |
FY2 2026 |
FY3 2027 |
FY4 2028 |
FY5 2029 |
|---|---|---|---|---|---|---|---|---|---|---|
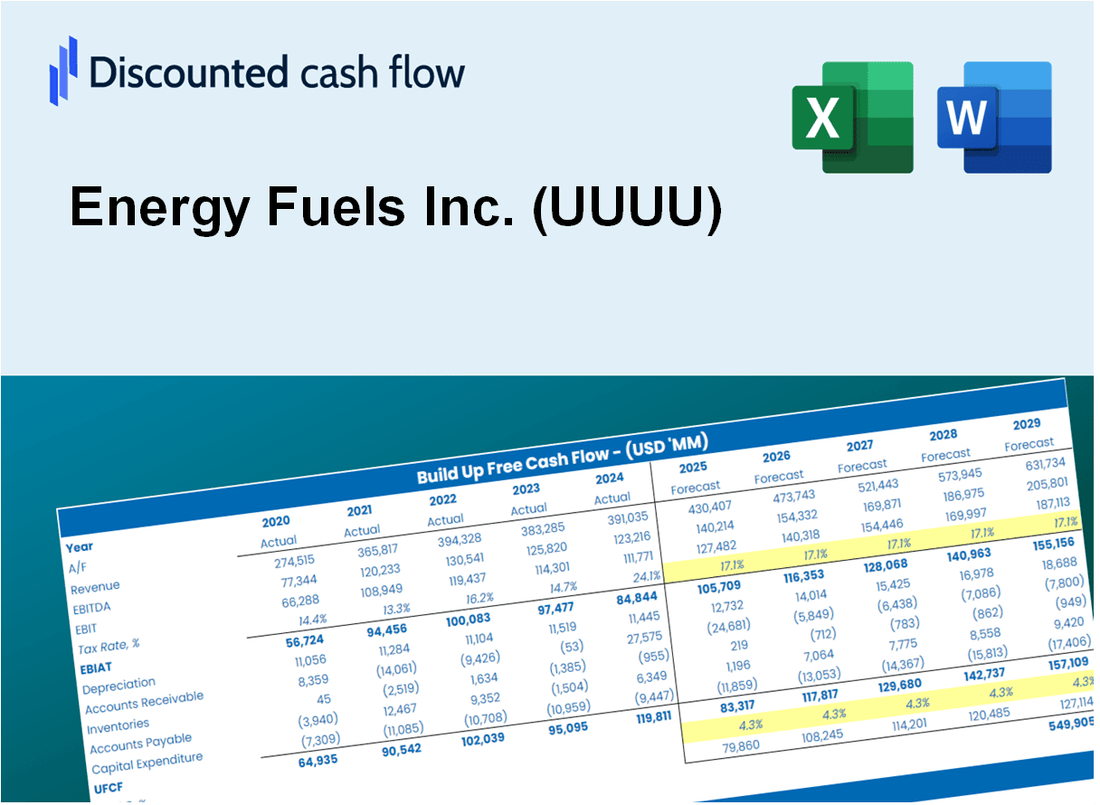
| Revenue | 1.7 | 3.2 | 12.5 | 37.9 | 78.1 | 154.7 | 306.3 | 606.4 | 1,200.8 | 2,377.7 |
| Revenue Growth, % | 0 | 92.04 | 293.06 | 203.06 | 105.95 | 98.01 | 98.01 | 98.01 | 98.01 | 98.01 |
| EBITDA | -22.3 | 6.0 | -55.1 | 104.0 | -43.0 | -17.0 | -33.7 | -66.8 | -132.3 | -261.9 |
| EBITDA, % | -1345.48 | 187.66 | -440.42 | 274.14 | -55.07 | -11.01 | -11.01 | -11.01 | -11.01 | -11.01 |
| Depreciation | 4.6 | 4.5 | 4.8 | 3.9 | 5.2 | 79.1 | 156.6 | 310.0 | 613.9 | 1,215.5 |
| Depreciation, % | 278.17 | 140.48 | 38.55 | 10.4 | 6.65 | 51.12 | 51.12 | 51.12 | 51.12 | 51.12 |
| EBIT | -26.9 | 1.5 | -59.9 | 100.0 | -48.2 | -35.4 | -70.2 | -138.9 | -275.1 | -544.7 |
| EBIT, % | -1623.64 | 47.17 | -478.98 | 263.74 | -61.72 | -22.91 | -22.91 | -22.91 | -22.91 | -22.91 |
| Total Cash | 22.4 | 113.0 | 75.0 | 190.5 | 119.5 | 154.7 | 306.3 | 606.4 | 1,200.8 | 2,377.7 |
| Total Cash, percent | .0 | .0 | .0 | .0 | .0 | .0 | .0 | .0 | .0 | .0 |
| Account Receivables | 1.2 | 4.0 | .5 | .8 | 37.8 | 69.6 | 137.9 | 273.1 | 540.7 | 1,070.7 |
| Account Receivables, % | 70.51 | 124.18 | 4.15 | 2.15 | 48.34 | 45.03 | 45.03 | 45.03 | 45.03 | 45.03 |
| Inventories | 27.6 | 30.8 | 38.2 | 38.9 | 66.5 | 150.1 | 297.2 | 588.4 | 1,165.1 | 2,307.0 |
| Inventories, % | 1663.15 | 966.46 | 304.87 | 102.48 | 85.14 | 97.03 | 97.03 | 97.03 | 97.03 | 97.03 |
| Accounts Payable | .5 | 3.0 | 3.7 | 1.0 | 7.5 | 51.4 | 101.7 | 201.4 | 398.7 | 789.5 |
| Accounts Payable, % | 29.13 | 95.41 | 29.2 | 2.65 | 9.61 | 33.2 | 33.2 | 33.2 | 33.2 | 33.2 |
| Capital Expenditure | -.6 | -1.4 | -2.0 | -44.7 | -29.4 | -72.5 | -143.5 | -284.2 | -562.8 | -1,114.4 |
| Capital Expenditure, % | -37.82 | -42.96 | -15.95 | -117.88 | -37.62 | -46.87 | -46.87 | -46.87 | -46.87 | -46.87 |
| Tax Rate, % | 0.92921 | 0.92921 | 0.92921 | 0.92921 | 0.92921 | 0.92921 | 0.92921 | 0.92921 | 0.92921 | 0.92921 |
| EBITAT | -26.8 | 1.6 | -59.8 | 99.9 | -47.8 | -35.3 | -69.9 | -138.5 | -274.2 | -543.0 |
| Depreciation | ||||||||||
| Changes in Account Receivables | ||||||||||
| Changes in Inventories | ||||||||||
| Changes in Accounts Payable | ||||||||||
| Capital Expenditure | ||||||||||
| UFCF | -51.1 | 1.3 | -60.4 | 55.4 | -130.0 | -100.4 | -221.9 | -439.5 | -870.2 | -1,723.0 |
| WACC, % | 13.4 | 13.4 | 13.4 | 13.4 | 13.4 | 13.4 | 13.4 | 13.4 | 13.4 | 13.4 |
| PV UFCF | ||||||||||
| SUM PV UFCF | -2,007.2 | |||||||||
| Long Term Growth Rate, % | 2.00 | |||||||||
| Free cash flow (T + 1) | -1,757 | |||||||||
| Terminal Value | -15,412 | |||||||||
| Present Terminal Value | -8,217 | |||||||||
| Enterprise Value | -10,224 | |||||||||
| Net Debt | -36 | |||||||||
| Equity Value | -10,188 | |||||||||
| Diluted Shares Outstanding, MM | 172 | |||||||||
| Equity Value Per Share | -59.25 |
What You Will Receive
- Genuine Energy Fuels Data: Preloaded financials – from revenue to EBIT – based on actual and projected figures for Energy Fuels Inc. (UUUU).
- Comprehensive Customization: Modify all essential parameters (yellow cells) including WACC, growth %, and tax rates.
- Immediate Valuation Updates: Automatic recalculations to assess the effects of changes on Energy Fuels Inc.'s (UUUU) fair value.
- Adaptable Excel Template: Designed for quick modifications, scenario analysis, and detailed forecasts.
- Efficient and Accurate: Eliminate the need to build models from the ground up while ensuring precision and adaptability.
Key Features
- Real-Time UUUU Data: Pre-populated with Energy Fuels Inc.'s historical performance metrics and future projections.
- Fully Customizable Inputs: Modify revenue growth rates, profit margins, WACC, tax rates, and capital expenditures as needed.
- Dynamic Valuation Model: Automatically recalculates Net Present Value (NPV) and intrinsic value based on your customized inputs.
- Scenario Testing: Develop various forecasting scenarios to evaluate different valuation results.
- User-Friendly Interface: Intuitive and organized, suitable for both industry professionals and newcomers.
How It Works
- Download the Template: Gain immediate access to the Excel-based UUUU DCF Calculator.
- Input Your Assumptions: Modify the yellow-highlighted cells for growth rates, WACC, margins, and other key factors.
- Instant Calculations: The model will automatically refresh Energy Fuels Inc.'s intrinsic value.
- Test Scenarios: Experiment with various assumptions to assess potential changes in valuation.
- Analyze and Decide: Leverage the results to inform your investment or financial analysis.
Why Choose Energy Fuels Inc. (UUUU)?
- Industry Leader: A prominent player in the uranium and vanadium sectors, ensuring reliability.
- Sustainable Practices: Committed to environmentally responsible mining and production.
- Diverse Portfolio: Offers a wide range of energy solutions to meet various market demands.
- Expert Team: Backed by experienced professionals dedicated to innovation and excellence.
- Strong Financial Performance: Proven track record of growth and profitability in the energy sector.
Who Should Use Energy Fuels Inc. (UUUU)?
- Investors: Gain insights into uranium and rare earth markets with a leading energy resource provider.
- Environmental Analysts: Assess sustainable mining practices and their impact on the energy sector.
- Consultants: Utilize comprehensive data for client reports on clean energy initiatives.
- Energy Enthusiasts: Explore innovative technologies in uranium extraction and renewable energy solutions.
- Educators and Students: Leverage real-world case studies in energy economics and resource management courses.
What the Template Contains
- Comprehensive DCF Model: Editable template with detailed valuation calculations for Energy Fuels Inc. (UUUU).
- Real-World Data: Energy Fuels’ historical and projected financials preloaded for analysis.
- Customizable Parameters: Adjust WACC, growth rates, and tax assumptions to test various scenarios.
- Financial Statements: Full annual and quarterly breakdowns for deeper insights into Energy Fuels Inc. (UUUU).
- Key Ratios: Built-in analysis for profitability, efficiency, and leverage specific to Energy Fuels Inc. (UUUU).
- Dashboard with Visual Outputs: Charts and tables for clear, actionable results related to Energy Fuels Inc. (UUUU).
Disclaimer
All information, articles, and product details provided on this website are for general informational and educational purposes only. We do not claim any ownership over, nor do we intend to infringe upon, any trademarks, copyrights, logos, brand names, or other intellectual property mentioned or depicted on this site. Such intellectual property remains the property of its respective owners, and any references here are made solely for identification or informational purposes, without implying any affiliation, endorsement, or partnership.
We make no representations or warranties, express or implied, regarding the accuracy, completeness, or suitability of any content or products presented. Nothing on this website should be construed as legal, tax, investment, financial, medical, or other professional advice. In addition, no part of this site—including articles or product references—constitutes a solicitation, recommendation, endorsement, advertisement, or offer to buy or sell any securities, franchises, or other financial instruments, particularly in jurisdictions where such activity would be unlawful.
All content is of a general nature and may not address the specific circumstances of any individual or entity. It is not a substitute for professional advice or services. Any actions you take based on the information provided here are strictly at your own risk. You accept full responsibility for any decisions or outcomes arising from your use of this website and agree to release us from any liability in connection with your use of, or reliance upon, the content or products found herein.