
|
Universal Insurance Holdings, Inc. (UVE) DCF -Bewertung |
Fully Editable: Tailor To Your Needs In Excel Or Sheets
Professional Design: Trusted, Industry-Standard Templates
Investor-Approved Valuation Models
MAC/PC Compatible, Fully Unlocked
No Expertise Is Needed; Easy To Follow
Universal Insurance Holdings, Inc. (UVE) Bundle
Gewinnen Sie mit unserem ausgefeilten DCF -Taschenrechner Einblick in Ihre Universal Insurance Holdings, Inc. (UVE) -Schanganalyse! Mit realen Daten (UVE) werden Sie mit dieser Excel -Vorlage Prognosen und Annahmen so ändern, dass die intrinsische Wert von Universal Insurance Holdings, Inc. genau berechnet wird.
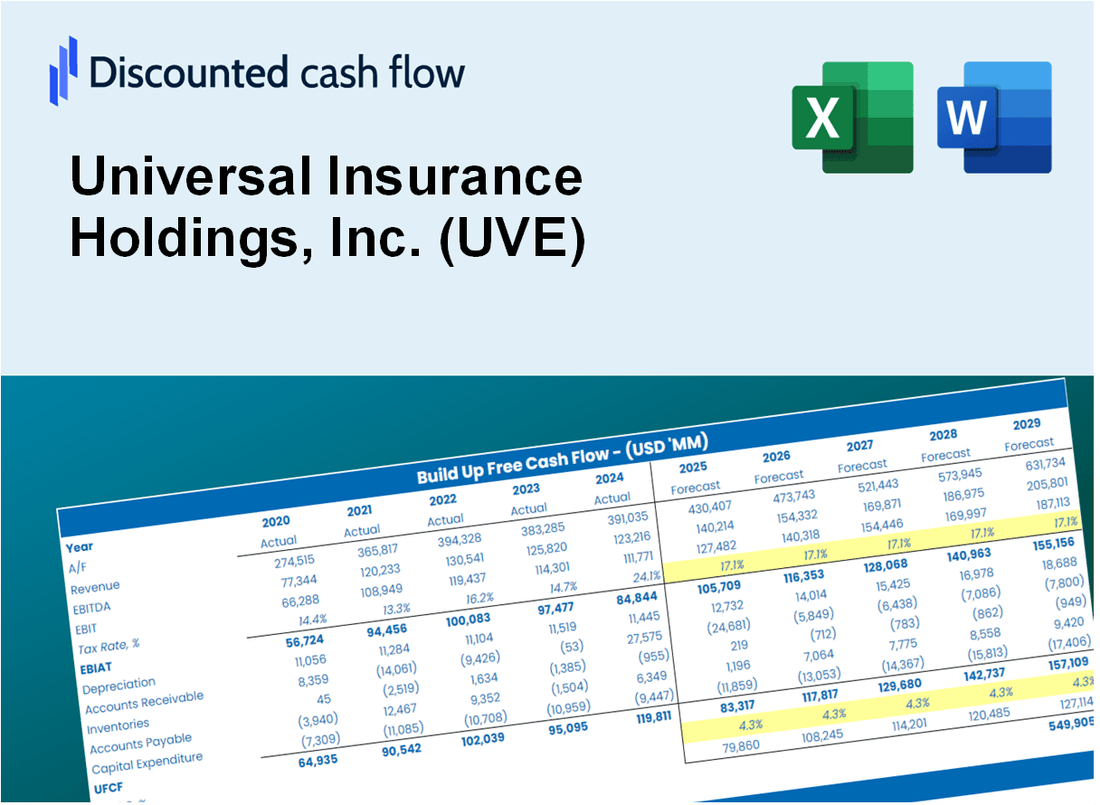
Discounted Cash Flow (DCF) - (USD MM)
| Year | AY1 2020 |
AY2 2021 |
AY3 2022 |
AY4 2023 |
AY5 2024 |
FY1 2025 |
FY2 2026 |
FY3 2027 |
FY4 2028 |
FY5 2029 |
|---|---|---|---|---|---|---|---|---|---|---|
| Revenue | 1,072.8 | 1,121.9 | 1,222.7 | 1,391.6 | 1,520.5 | 1,659.8 | 1,811.9 | 1,977.9 | 2,159.1 | 2,356.9 |
| Revenue Growth, % | 0 | 4.58 | 8.99 | 13.82 | 9.27 | 9.16 | 9.16 | 9.16 | 9.16 | 9.16 |
| EBITDA | 29.4 | 35.9 | -14.0 | 101.5 | 96.5 | 61.2 | 66.8 | 72.9 | 79.6 | 86.9 |
| EBITDA, % | 2.74 | 3.2 | -1.15 | 7.29 | 6.35 | 3.69 | 3.69 | 3.69 | 3.69 | 3.69 |
| Depreciation | 5.1 | 6.9 | 7.3 | 7.3 | 6.1 | 8.7 | 9.5 | 10.4 | 11.3 | 12.3 |
| Depreciation, % | 0.47606 | 0.61621 | 0.59673 | 0.52552 | 0.40229 | 0.52336 | 0.52336 | 0.52336 | 0.52336 | 0.52336 |
| EBIT | 24.3 | 29.0 | -21.3 | 94.2 | 90.4 | 52.5 | 57.3 | 62.6 | 68.3 | 74.6 |
| EBIT, % | 2.27 | 2.58 | -1.75 | 6.77 | 5.94 | 3.16 | 3.16 | 3.16 | 3.16 | 3.16 |
| Total Cash | 167.2 | 250.5 | 388.7 | 1,461.6 | 419.4 | 654.9 | 714.9 | 780.4 | 851.9 | 930.0 |
| Total Cash, percent | .0 | .0 | .0 | .0 | .0 | .0 | .0 | .0 | .0 | .0 |
| Account Receivables | 227.3 | 250.5 | 69.6 | 296.2 | 705.6 | 388.0 | 423.6 | 462.4 | 504.8 | 551.0 |
| Account Receivables, % | 21.19 | 22.33 | 5.69 | 21.28 | 46.4 | 23.38 | 23.38 | 23.38 | 23.38 | 23.38 |
| Inventories | .0 | -370.1 | 1,014.6 | -787.7 | .0 | -21.9 | -24.0 | -26.1 | -28.5 | -31.2 |
| Inventories, % | 0 | -32.99 | 82.99 | -56.61 | 0 | -1.32 | -1.32 | -1.32 | -1.32 | -1.32 |
| Accounts Payable | 10.3 | 188.7 | 403.0 | 212.8 | 220.3 | 267.3 | 291.8 | 318.5 | 347.7 | 379.6 |
| Accounts Payable, % | 0.96125 | 16.82 | 32.96 | 15.29 | 14.49 | 16.11 | 16.11 | 16.11 | 16.11 | 16.11 |
| Capital Expenditure | -17.2 | -7.2 | -4.9 | -4.0 | -7.4 | -11.4 | -12.4 | -13.5 | -14.8 | -16.1 |
| Capital Expenditure, % | -1.6 | -0.64411 | -0.40068 | -0.28881 | -0.48457 | -0.6846 | -0.6846 | -0.6846 | -0.6846 | -0.6846 |
| Tax Rate, % | 30.35 | 30.35 | 30.35 | 30.35 | 30.35 | 30.35 | 30.35 | 30.35 | 30.35 | 30.35 |
| EBITAT | 19.2 | 20.8 | -17.4 | 71.2 | 62.9 | 39.7 | 43.3 | 47.3 | 51.6 | 56.3 |
| Depreciation | ||||||||||
| Changes in Account Receivables | ||||||||||
| Changes in Inventories | ||||||||||
| Changes in Accounts Payable | ||||||||||
| Capital Expenditure | ||||||||||
| UFCF | -209.9 | 545.7 | -1,004.4 | 1,460.1 | -1,127.9 | 423.4 | 31.3 | 34.2 | 37.3 | 40.7 |
| WACC, % | 7.04 | 7.01 | 7.06 | 7.03 | 6.99 | 7.03 | 7.03 | 7.03 | 7.03 | 7.03 |
| PV UFCF | ||||||||||
| SUM PV UFCF | 508.3 | |||||||||
| Long Term Growth Rate, % | 2.00 | |||||||||
| Free cash flow (T + 1) | 42 | |||||||||
| Terminal Value | 827 | |||||||||
| Present Terminal Value | 589 | |||||||||
| Enterprise Value | 1,097 | |||||||||
| Net Debt | -158 | |||||||||
| Equity Value | 1,255 | |||||||||
| Diluted Shares Outstanding, MM | 29 | |||||||||
| Equity Value Per Share | 42.89 |
What You Will Get
- Pre-Filled Financial Model: Universal Insurance Holdings, Inc.'s (UVE) actual data enables precise DCF valuation.
- Full Forecast Control: Adjust revenue growth, margins, WACC, and other key drivers tailored to the insurance industry.
- Instant Calculations: Automatic updates ensure you see results in real-time as you make changes.
- Investor-Ready Template: A polished Excel file designed for professional-grade valuation in the insurance sector.
- Customizable and Reusable: Designed for flexibility, allowing repeated use for comprehensive forecasts.
Key Features
- Comprehensive DCF Calculator: Features detailed unlevered and levered DCF valuation models tailored for Universal Insurance Holdings, Inc. (UVE).
- WACC Calculator: Includes a pre-built Weighted Average Cost of Capital sheet with customizable inputs specific to the insurance sector.
- Adjustable Forecast Assumptions: Easily modify growth rates, capital expenditures, and discount rates for accurate projections.
- Integrated Financial Ratios: Evaluate profitability, leverage, and efficiency ratios specifically for Universal Insurance Holdings, Inc. (UVE).
- Interactive Dashboard and Charts: Visual representations summarize essential valuation metrics for straightforward analysis.
How It Works
- Download: Obtain the pre-prepared Excel file featuring Universal Insurance Holdings, Inc. (UVE) financial data.
- Customize: Modify forecasts, such as premium growth, loss ratio, and discount rate.
- Update Automatically: The intrinsic value and NPV calculations refresh in real-time.
- Test Scenarios: Generate various projections and analyze results immediately.
- Make Decisions: Leverage the valuation insights to inform your investment choices.
Why Choose This Calculator for Universal Insurance Holdings, Inc. (UVE)?
- Accuracy: Utilizes real UVE financial data to ensure precision.
- Flexibility: Allows users to effortlessly test and adjust inputs.
- Time-Saving: Eliminate the need to create a DCF model from the ground up.
- Professional-Grade: Crafted with the expertise and usability expected at the CFO level.
- User-Friendly: Simple to navigate, even for those without extensive financial modeling skills.
Who Should Use This Product?
- Insurance Students: Understand underwriting principles and apply them using real-world data.
- Academics: Integrate industry-standard models into your teaching or research projects.
- Investors: Evaluate your investment strategies and analyze valuation metrics for Universal Insurance Holdings, Inc. (UVE).
- Analysts: Enhance your analysis with a ready-to-use, customizable financial model specific to the insurance sector.
- Small Business Owners: Learn how large insurance firms like Universal Insurance Holdings, Inc. (UVE) assess risk and value.
What the Template Contains
- Pre-Filled Data: Includes Universal Insurance Holdings, Inc.'s (UVE) historical financials and forecasts.
- Discounted Cash Flow Model: Editable DCF valuation model with automatic calculations.
- Weighted Average Cost of Capital (WACC): A dedicated sheet for calculating WACC based on custom inputs.
- Key Financial Ratios: Analyze Universal Insurance Holdings, Inc.'s (UVE) profitability, efficiency, and leverage.
- Customizable Inputs: Edit revenue growth, margins, and tax rates with ease.
- Clear Dashboard: Charts and tables summarizing key valuation results.
Disclaimer
All information, articles, and product details provided on this website are for general informational and educational purposes only. We do not claim any ownership over, nor do we intend to infringe upon, any trademarks, copyrights, logos, brand names, or other intellectual property mentioned or depicted on this site. Such intellectual property remains the property of its respective owners, and any references here are made solely for identification or informational purposes, without implying any affiliation, endorsement, or partnership.
We make no representations or warranties, express or implied, regarding the accuracy, completeness, or suitability of any content or products presented. Nothing on this website should be construed as legal, tax, investment, financial, medical, or other professional advice. In addition, no part of this site—including articles or product references—constitutes a solicitation, recommendation, endorsement, advertisement, or offer to buy or sell any securities, franchises, or other financial instruments, particularly in jurisdictions where such activity would be unlawful.
All content is of a general nature and may not address the specific circumstances of any individual or entity. It is not a substitute for professional advice or services. Any actions you take based on the information provided here are strictly at your own risk. You accept full responsibility for any decisions or outcomes arising from your use of this website and agree to release us from any liability in connection with your use of, or reliance upon, the content or products found herein.