
|
Uxin Limited (UXIN) DCF -Bewertung |
Fully Editable: Tailor To Your Needs In Excel Or Sheets
Professional Design: Trusted, Industry-Standard Templates
Investor-Approved Valuation Models
MAC/PC Compatible, Fully Unlocked
No Expertise Is Needed; Easy To Follow
Uxin Limited (UXIN) Bundle
Bewerten Sie die finanziellen Aussichten von Uxin Limited wie ein Experte! Dieser (UXIN) DCF-Taschenrechner bietet vorgefüllte Finanzdaten und bietet eine vollständige Flexibilität, um das Umsatzwachstum, WACC, Margen und andere wesentliche Annahmen zu ändern, um sich an Ihren Vorhersagen auszurichten.
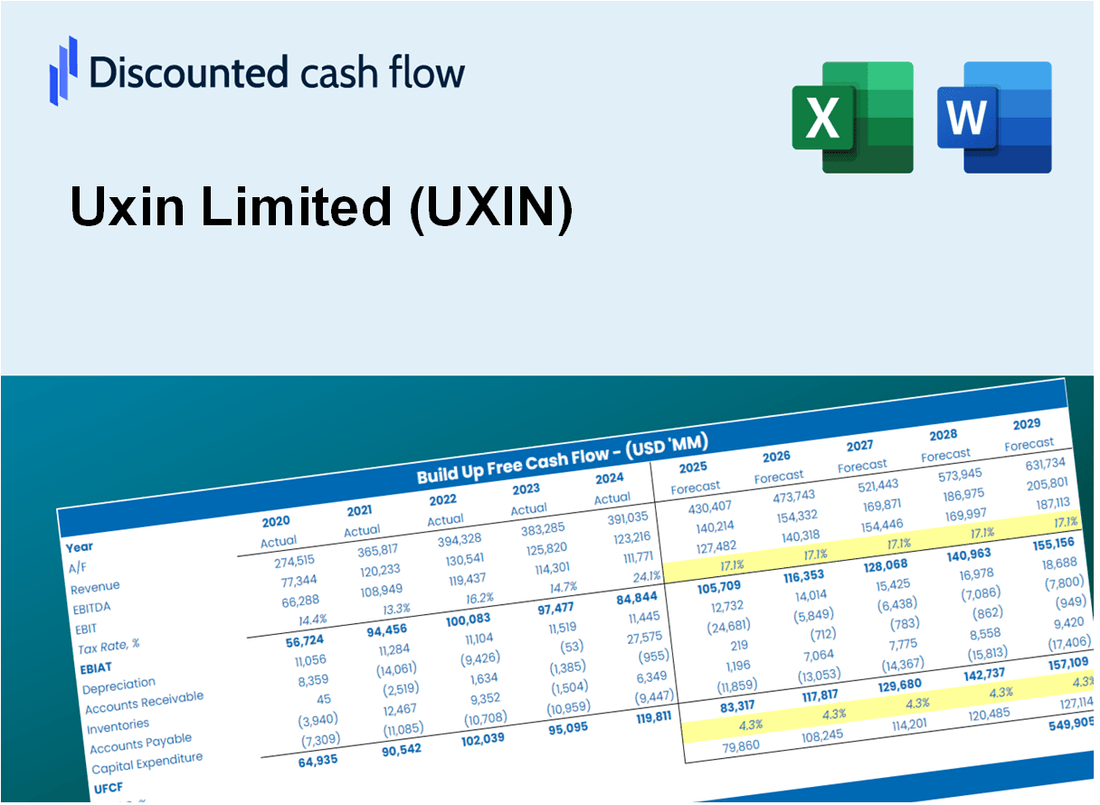
Discounted Cash Flow (DCF) - (USD MM)
| Year | AY1 2020 |
AY2 2021 |
AY3 2022 |
AY4 2023 |
AY5 2024 |
FY1 2025 |
FY2 2026 |
FY3 2027 |
FY4 2028 |
FY5 2029 |
|---|---|---|---|---|---|---|---|---|---|---|
| Revenue | 92.4 | 229.9 | 289.4 | 193.2 | 280.2 | 376.6 | 506.2 | 680.4 | 914.5 | 1,229.1 |
| Revenue Growth, % | 0 | 148.87 | 25.86 | -33.24 | 45.02 | 34.41 | 34.41 | 34.41 | 34.41 | 34.41 |
| EBITDA | -79.2 | -39.2 | -51.1 | -38.2 | -31.2 | -113.9 | -153.1 | -205.8 | -276.7 | -371.9 |
| EBITDA, % | -85.69 | -17.05 | -17.65 | -19.77 | -11.12 | -30.26 | -30.26 | -30.26 | -30.26 | -30.26 |
| Depreciation | -1.5 | .0 | -.9 | 5.7 | 1.5 | 1.2 | 1.6 | 2.1 | 2.9 | 3.9 |
| Depreciation, % | -1.62 | -0.00232257 | -0.3138 | 2.97 | 0.55163 | 0.316 | 0.316 | 0.316 | 0.316 | 0.316 |
| EBIT | -77.7 | -39.2 | -50.2 | -43.9 | -32.7 | -115.1 | -154.7 | -208.0 | -279.6 | -375.8 |
| EBIT, % | -84.06 | -17.05 | -17.33 | -22.74 | -11.67 | -30.57 | -30.57 | -30.57 | -30.57 | -30.57 |
| Total Cash | 27.1 | 20.9 | 13.0 | 3.3 | 3.5 | 34.5 | 46.4 | 62.4 | 83.9 | 112.7 |
| Total Cash, percent | .0 | .0 | .0 | .0 | .0 | .0 | .0 | .0 | .0 | .0 |
| Account Receivables | 58.0 | 32.7 | 4.3 | 9.8 | .6 | 63.1 | 84.8 | 113.9 | 153.1 | 205.8 |
| Account Receivables, % | 62.78 | 14.2 | 1.48 | 5.06 | 0.20817 | 16.74 | 16.74 | 16.74 | 16.74 | 16.74 |
| Inventories | 9.8 | 61.3 | 15.6 | 15.5 | 29.1 | 46.0 | 61.8 | 83.1 | 111.7 | 150.1 |
| Inventories, % | 10.59 | 26.66 | 5.39 | 8.04 | 10.4 | 12.21 | 12.21 | 12.21 | 12.21 | 12.21 |
| Accounts Payable | 14.2 | 13.1 | 11.3 | 11.3 | 11.5 | 26.3 | 35.4 | 47.6 | 63.9 | 85.9 |
| Accounts Payable, % | 15.39 | 5.68 | 3.92 | 5.87 | 4.09 | 6.99 | 6.99 | 6.99 | 6.99 | 6.99 |
| Capital Expenditure | -.1 | -2.6 | -4.7 | -1.8 | -1.0 | -3.1 | -4.1 | -5.6 | -7.5 | -10.0 |
| Capital Expenditure, % | -0.06282248 | -1.14 | -1.61 | -0.92331 | -0.3453 | -0.81672 | -0.81672 | -0.81672 | -0.81672 | -0.81672 |
| Tax Rate, % | -2.52 | -2.52 | -2.52 | -2.52 | -2.52 | -2.52 | -2.52 | -2.52 | -2.52 | -2.52 |
| EBITAT | -77.7 | -39.2 | -46.8 | -42.9 | -33.5 | -113.0 | -151.9 | -204.2 | -274.5 | -368.9 |
| Depreciation | ||||||||||
| Changes in Account Receivables | ||||||||||
| Changes in Inventories | ||||||||||
| Changes in Accounts Payable | ||||||||||
| Capital Expenditure | ||||||||||
| UFCF | -132.8 | -69.1 | 20.0 | -44.4 | -37.3 | -179.4 | -182.9 | -245.9 | -330.5 | -444.2 |
| WACC, % | 5.26 | 5.26 | 4.9 | 5.14 | 5.26 | 5.16 | 5.16 | 5.16 | 5.16 | 5.16 |
| PV UFCF | ||||||||||
| SUM PV UFCF | -1,162.8 | |||||||||
| Long Term Growth Rate, % | 2.00 | |||||||||
| Free cash flow (T + 1) | -453 | |||||||||
| Terminal Value | -14,318 | |||||||||
| Present Terminal Value | -11,131 | |||||||||
| Enterprise Value | -12,294 | |||||||||
| Net Debt | 242 | |||||||||
| Equity Value | -12,536 | |||||||||
| Diluted Shares Outstanding, MM | 0 | |||||||||
| Equity Value Per Share | -516,299.19 |
What You Will Get
- Editable Forecast Inputs: Adjust key assumptions (growth %, margins, WACC) effortlessly to explore various scenarios.
- Real-World Data: Uxin Limited’s (UXIN) financial data pre-loaded to facilitate your analysis.
- Automatic DCF Outputs: The template computes Net Present Value (NPV) and intrinsic value automatically.
- Customizable and Professional: A sleek Excel model tailored to meet your valuation requirements.
- Built for Analysts and Investors: Perfect for evaluating projections, confirming strategies, and enhancing efficiency.
Key Features
- Customizable Financial Inputs: Adjust essential metrics such as sales growth, operating margin, and capital investments.
- Instant DCF Valuation: Quickly computes intrinsic value, net present value, and other financial metrics.
- High-Precision Results: Leverages Uxin Limited's (UXIN) actual financial data for accurate valuation insights.
- Simplified Scenario Testing: Easily evaluate various assumptions and analyze different outcomes.
- Efficiency Booster: Avoid the hassle of constructing intricate valuation models from the ground up.
How It Works
- Download: Get the comprehensive Excel file featuring Uxin Limited’s (UXIN) financial data.
- Customize: Modify forecasts, including revenue growth, EBITDA %, and WACC as per your analysis.
- Update Automatically: Enjoy real-time updates for intrinsic value and NPV calculations.
- Test Scenarios: Develop various projections and instantly compare the results.
- Make Decisions: Leverage the valuation outcomes to inform your investment strategy.
Why Choose Uxin Limited (UXIN)?
- Streamlined Process: Skip the complexities – our platform is user-friendly and efficient.
- Enhanced Accuracy: Access to up-to-date market data minimizes valuation discrepancies.
- Fully Adaptable: Customize your experience to align with your investment strategies and goals.
- User-Friendly Interface: Intuitive dashboards make data interpretation straightforward.
- Backed by Professionals: Developed with insights from industry experts to ensure reliability and effectiveness.
Who Should Use This Product?
- Individual Investors: Gain insights to make informed decisions about trading Uxin Limited (UXIN) shares.
- Financial Analysts: Enhance valuation processes with comprehensive financial models tailored for Uxin Limited (UXIN).
- Consultants: Provide clients with expert valuation analyses of Uxin Limited (UXIN) swiftly and accurately.
- Business Owners: Learn about the valuation of companies like Uxin Limited (UXIN) to inform your own business strategies.
- Finance Students: Explore valuation methodologies using real data and case studies involving Uxin Limited (UXIN).
What the Template Contains
- Pre-Filled DCF Model: Uxin Limited’s (UXIN) financial data preloaded for immediate use.
- WACC Calculator: Detailed calculations for Weighted Average Cost of Capital.
- Financial Ratios: Evaluate Uxin Limited’s profitability, leverage, and efficiency.
- Editable Inputs: Change assumptions such as growth, margins, and CAPEX to fit your scenarios.
- Financial Statements: Annual and quarterly reports to support detailed analysis.
- Interactive Dashboard: Easily visualize key valuation metrics and results.
Disclaimer
All information, articles, and product details provided on this website are for general informational and educational purposes only. We do not claim any ownership over, nor do we intend to infringe upon, any trademarks, copyrights, logos, brand names, or other intellectual property mentioned or depicted on this site. Such intellectual property remains the property of its respective owners, and any references here are made solely for identification or informational purposes, without implying any affiliation, endorsement, or partnership.
We make no representations or warranties, express or implied, regarding the accuracy, completeness, or suitability of any content or products presented. Nothing on this website should be construed as legal, tax, investment, financial, medical, or other professional advice. In addition, no part of this site—including articles or product references—constitutes a solicitation, recommendation, endorsement, advertisement, or offer to buy or sell any securities, franchises, or other financial instruments, particularly in jurisdictions where such activity would be unlawful.
All content is of a general nature and may not address the specific circumstances of any individual or entity. It is not a substitute for professional advice or services. Any actions you take based on the information provided here are strictly at your own risk. You accept full responsibility for any decisions or outcomes arising from your use of this website and agree to release us from any liability in connection with your use of, or reliance upon, the content or products found herein.