
|
Valaris Limited (VAL) DCF -Bewertung |
Fully Editable: Tailor To Your Needs In Excel Or Sheets
Professional Design: Trusted, Industry-Standard Templates
Investor-Approved Valuation Models
MAC/PC Compatible, Fully Unlocked
No Expertise Is Needed; Easy To Follow
Valaris Limited (VAL) Bundle
Verbessern Sie Ihre Anlagestrategien mit dem DCF -Taschenrechner von Valaris Limited (VAL)! Verwenden Sie echte Finanzdaten aus Valaris, passen Sie die Erwartungen und Ausgaben an und beobachten Sie die unmittelbaren Auswirkungen auf den inneren Wert von Valaris Limited.
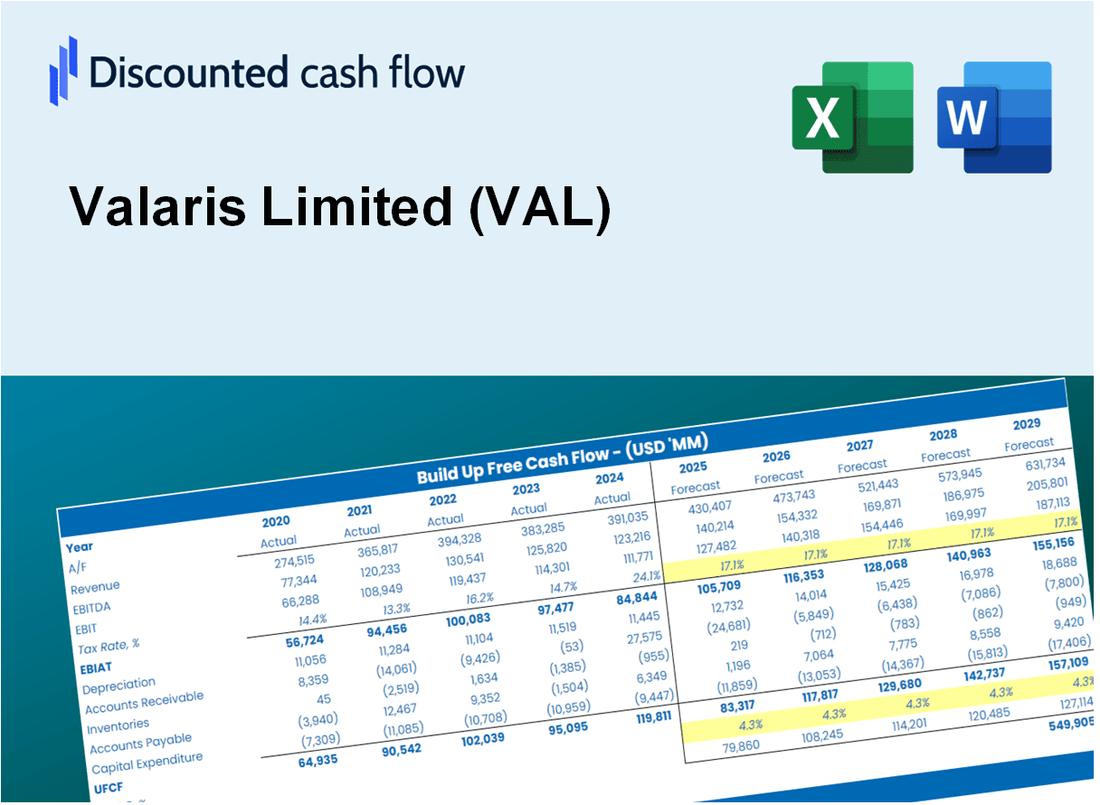
Discounted Cash Flow (DCF) - (USD MM)
| Year | AY1 2020 |
AY2 2021 |
AY3 2022 |
AY4 2023 |
AY5 2024 |
FY1 2025 |
FY2 2026 |
FY3 2027 |
FY4 2028 |
FY5 2029 |
|---|---|---|---|---|---|---|---|---|---|---|
| Revenue | 1,427.2 | 1,232.0 | 1,602.5 | 1,784.2 | 2,362.6 | 2,717.9 | 3,126.6 | 3,596.8 | 4,137.7 | 4,759.9 |
| Revenue Growth, % | 0 | -13.68 | 30.07 | 11.34 | 32.42 | 15.04 | 15.04 | 15.04 | 15.04 | 15.04 |
| EBITDA | -4,264.2 | -4,175.7 | 361.4 | 254.2 | 577.1 | -754.3 | -867.8 | -998.3 | -1,148.4 | -1,321.1 |
| EBITDA, % | -298.78 | -338.94 | 22.55 | 14.25 | 24.43 | -27.75 | -27.75 | -27.75 | -27.75 | -27.75 |
| Depreciation | 554.4 | 225.7 | 91.2 | 101.1 | 122.1 | 400.6 | 460.8 | 530.1 | 609.8 | 701.5 |
| Depreciation, % | 38.85 | 18.32 | 5.69 | 5.67 | 5.17 | 14.74 | 14.74 | 14.74 | 14.74 | 14.74 |
| EBIT | -4,818.6 | -4,401.4 | 270.2 | 153.1 | 455.0 | -844.2 | -971.1 | -1,117.2 | -1,285.2 | -1,478.4 |
| EBIT, % | -337.63 | -357.26 | 16.86 | 8.58 | 19.26 | -31.06 | -31.06 | -31.06 | -31.06 | -31.06 |
| Total Cash | 325.8 | 608.7 | 724.1 | 620.5 | 368.2 | 912.0 | 1,049.2 | 1,207.0 | 1,388.5 | 1,597.3 |
| Total Cash, percent | .0 | .0 | .0 | .0 | .0 | .0 | .0 | .0 | .0 | .0 |
| Account Receivables | 449.2 | 444.2 | 449.1 | 459.3 | 571.2 | 790.8 | 909.7 | 1,046.5 | 1,203.8 | 1,384.9 |
| Account Receivables, % | 31.47 | 36.06 | 28.02 | 25.74 | 24.18 | 29.09 | 29.09 | 29.09 | 29.09 | 29.09 |
| Inventories | 279.4 | 35.9 | 24.4 | .0 | .0 | 130.5 | 150.2 | 172.7 | 198.7 | 228.6 |
| Inventories, % | 19.58 | 2.91 | 1.52 | 0 | 0 | 4.8 | 4.8 | 4.8 | 4.8 | 4.8 |
| Accounts Payable | 176.4 | 225.8 | 256.5 | 400.1 | 328.5 | 451.3 | 519.2 | 597.2 | 687.0 | 790.4 |
| Accounts Payable, % | 12.36 | 18.33 | 16.01 | 22.42 | 13.9 | 16.6 | 16.6 | 16.6 | 16.6 | 16.6 |
| Capital Expenditure | -93.8 | -58.9 | -207.0 | -696.1 | -455.1 | -448.7 | -516.2 | -593.8 | -683.1 | -785.8 |
| Capital Expenditure, % | -6.57 | -4.78 | -12.92 | -39.01 | -19.26 | -16.51 | -16.51 | -16.51 | -16.51 | -16.51 |
| Tax Rate, % | -0.8644 | -0.8644 | -0.8644 | -0.8644 | -0.8644 | -0.8644 | -0.8644 | -0.8644 | -0.8644 | -0.8644 |
| EBITAT | -4,574.3 | -4,453.9 | 212.1 | 1,573.5 | 458.9 | -799.3 | -919.5 | -1,057.7 | -1,216.8 | -1,399.8 |
| Depreciation | ||||||||||
| Changes in Account Receivables | ||||||||||
| Changes in Inventories | ||||||||||
| Changes in Accounts Payable | ||||||||||
| Capital Expenditure | ||||||||||
| UFCF | -4,665.9 | -3,989.2 | 133.6 | 1,136.3 | -57.6 | -1,074.7 | -1,045.5 | -1,202.8 | -1,383.6 | -1,591.7 |
| WACC, % | 8.5 | 8.6 | 8.21 | 8.6 | 8.6 | 8.5 | 8.5 | 8.5 | 8.5 | 8.5 |
| PV UFCF | ||||||||||
| SUM PV UFCF | -4,877.4 | |||||||||
| Long Term Growth Rate, % | 4.00 | |||||||||
| Free cash flow (T + 1) | -1,655 | |||||||||
| Terminal Value | -36,793 | |||||||||
| Present Terminal Value | -24,470 | |||||||||
| Enterprise Value | -29,348 | |||||||||
| Net Debt | 799 | |||||||||
| Equity Value | -30,147 | |||||||||
| Diluted Shares Outstanding, MM | 73 | |||||||||
| Equity Value Per Share | -413.54 |
What You Will Get
- Real VAL Financial Data: Pre-filled with Valaris Limited's historical and projected data for precise analysis.
- Fully Editable Template: Modify key inputs like revenue growth, WACC, and EBITDA % with ease.
- Automatic Calculations: See Valaris Limited's intrinsic value update instantly based on your changes.
- Professional Valuation Tool: Designed for investors, analysts, and consultants seeking accurate DCF results.
- User-Friendly Design: Simple structure and clear instructions for all experience levels.
Key Features
- Comprehensive Valaris Data: Gain access to reliable pre-loaded historical figures and future forecasts for Valaris Limited (VAL).
- Tailorable Forecast Variables: Modify highlighted cells to adjust assumptions like WACC, growth rates, and profit margins.
- Real-Time Calculations: Automatic recalculations for DCF, Net Present Value (NPV), and cash flow assessments.
- User-Friendly Dashboard: Intuitive charts and summaries to effectively illustrate your valuation findings.
- Designed for All Skill Levels: A straightforward and user-friendly layout suitable for investors, CFOs, and consultants alike.
How It Works
- Step 1: Download the Excel file.
- Step 2: Review pre-entered Valaris Limited (VAL) data (historical and projected).
- Step 3: Adjust key assumptions (yellow cells) based on your analysis.
- Step 4: View automatic recalculations for Valaris Limited’s (VAL) intrinsic value.
- Step 5: Use the outputs for investment decisions or reporting.
Why Choose This Calculator for Valaris Limited (VAL)?
- All-in-One Solution: Combines DCF, WACC, and financial ratio analyses tailored for Valaris Limited (VAL).
- Flexible Inputs: Modify yellow-highlighted cells to explore different financial scenarios.
- In-Depth Analysis: Automatically computes Valaris Limited (VAL)’s intrinsic value and Net Present Value.
- Preloaded Information: Access to historical and projected data for precise calculations.
- High-Quality Standards: Perfect for financial analysts, investors, and business advisors focusing on Valaris Limited (VAL).
Who Should Use This Product?
- Finance Students: Master valuation techniques and apply them using real data from Valaris Limited (VAL).
- Academics: Integrate professional financial models into your coursework or research focused on Valaris Limited (VAL).
- Investors: Evaluate your own assumptions and analyze valuation outcomes for Valaris Limited (VAL) stock.
- Analysts: Enhance your efficiency with a pre-built, customizable DCF model tailored for Valaris Limited (VAL).
- Small Business Owners: Understand how major public companies like Valaris Limited (VAL) are assessed and valued.
What the Template Contains
- Pre-Filled DCF Model: Valaris Limited’s (VAL) financial data preloaded for immediate use.
- WACC Calculator: Detailed calculations for Weighted Average Cost of Capital.
- Financial Ratios: Evaluate Valaris Limited’s (VAL) profitability, leverage, and efficiency.
- Editable Inputs: Change assumptions such as growth, margins, and CAPEX to fit your scenarios.
- Financial Statements: Annual and quarterly reports to support detailed analysis.
- Interactive Dashboard: Easily visualize key valuation metrics and results.
Disclaimer
All information, articles, and product details provided on this website are for general informational and educational purposes only. We do not claim any ownership over, nor do we intend to infringe upon, any trademarks, copyrights, logos, brand names, or other intellectual property mentioned or depicted on this site. Such intellectual property remains the property of its respective owners, and any references here are made solely for identification or informational purposes, without implying any affiliation, endorsement, or partnership.
We make no representations or warranties, express or implied, regarding the accuracy, completeness, or suitability of any content or products presented. Nothing on this website should be construed as legal, tax, investment, financial, medical, or other professional advice. In addition, no part of this site—including articles or product references—constitutes a solicitation, recommendation, endorsement, advertisement, or offer to buy or sell any securities, franchises, or other financial instruments, particularly in jurisdictions where such activity would be unlawful.
All content is of a general nature and may not address the specific circumstances of any individual or entity. It is not a substitute for professional advice or services. Any actions you take based on the information provided here are strictly at your own risk. You accept full responsibility for any decisions or outcomes arising from your use of this website and agree to release us from any liability in connection with your use of, or reliance upon, the content or products found herein.