
|
Vicat S.A. (VCT.PA) DCF -Bewertung |
Fully Editable: Tailor To Your Needs In Excel Or Sheets
Professional Design: Trusted, Industry-Standard Templates
Investor-Approved Valuation Models
MAC/PC Compatible, Fully Unlocked
No Expertise Is Needed; Easy To Follow
Vicat S.A. (VCT.PA) Bundle
Vereinfachen Sie die Bewertung von Vicat S.A. (VCTPA) mit diesem anpassbaren DCF -Taschenrechner! Mit echten Vicat S.A. (VCTPA) -Fonds und einstellbaren Prognoseeingaben können Sie Szenarien testen und Vicat S.A. (VCTPA) in Minuten aufdecken.
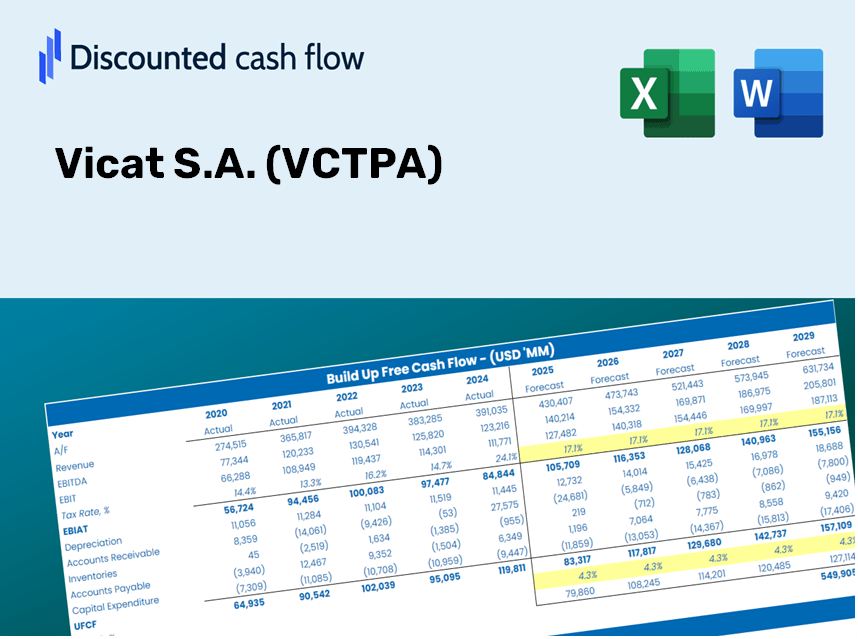
Discounted Cash Flow (DCF) - (USD MM)
| Year | AY1 2020 |
AY2 2021 |
AY3 2022 |
AY4 2023 |
AY5 2024 |
FY1 2025 |
FY2 2026 |
FY3 2027 |
FY4 2028 |
FY5 2029 |
|---|---|---|---|---|---|---|---|---|---|---|
| Revenue | 2,805.2 | 3,122.9 | 3,642.1 | 3,937.2 | 3,884.1 | 4,221.2 | 4,587.4 | 4,985.5 | 5,418.0 | 5,888.2 |
| Revenue Growth, % | 0 | 11.33 | 16.62 | 8.1 | -1.35 | 8.68 | 8.68 | 8.68 | 8.68 | 8.68 |
| EBITDA | 583.3 | 553.5 | 497.9 | 785.5 | 835.3 | 790.6 | 859.2 | 933.7 | 1,014.8 | 1,102.8 |
| EBITDA, % | 20.79 | 17.72 | 13.67 | 19.95 | 21.51 | 18.73 | 18.73 | 18.73 | 18.73 | 18.73 |
| Depreciation | 276.8 | 198.2 | 218.7 | 343.5 | 356.1 | 338.7 | 368.0 | 400.0 | 434.7 | 472.4 |
| Depreciation, % | 9.87 | 6.35 | 6.01 | 8.73 | 9.17 | 8.02 | 8.02 | 8.02 | 8.02 | 8.02 |
| EBIT | 306.5 | 355.3 | 279.2 | 442.0 | 479.2 | 451.9 | 491.1 | 533.8 | 580.1 | 630.4 |
| EBIT, % | 10.93 | 11.38 | 7.67 | 11.23 | 12.34 | 10.71 | 10.71 | 10.71 | 10.71 | 10.71 |
| Total Cash | 422.8 | 527.4 | 503.6 | 493.5 | 535.7 | 608.8 | 661.7 | 719.1 | 781.5 | 849.3 |
| Total Cash, percent | .0 | .0 | .0 | .0 | .0 | .0 | .0 | .0 | .0 | .0 |
| Account Receivables | 513.0 | 577.7 | 605.7 | 606.7 | 556.3 | 701.9 | 762.8 | 829.0 | 901.0 | 979.1 |
| Account Receivables, % | 18.29 | 18.5 | 16.63 | 15.41 | 14.32 | 16.63 | 16.63 | 16.63 | 16.63 | 16.63 |
| Inventories | 354.9 | 429.2 | 560.8 | 568.7 | 542.2 | 592.6 | 644.1 | 699.9 | 760.7 | 826.7 |
| Inventories, % | 12.65 | 13.74 | 15.4 | 14.44 | 13.96 | 14.04 | 14.04 | 14.04 | 14.04 | 14.04 |
| Accounts Payable | 375.3 | 459.6 | 540.4 | 503.5 | 478.8 | 574.5 | 624.4 | 678.5 | 737.4 | 801.4 |
| Accounts Payable, % | 13.38 | 14.72 | 14.84 | 12.79 | 12.33 | 13.61 | 13.61 | 13.61 | 13.61 | 13.61 |
| Capital Expenditure | -319.4 | -386.6 | -422.4 | -329.0 | -344.3 | -443.9 | -482.4 | -524.3 | -569.8 | -619.2 |
| Capital Expenditure, % | -11.39 | -12.38 | -11.6 | -8.36 | -8.86 | -10.52 | -10.52 | -10.52 | -10.52 | -10.52 |
| Tax Rate, % | 29.29 | 29.29 | 29.29 | 29.29 | 29.29 | 29.29 | 29.29 | 29.29 | 29.29 | 29.29 |
| EBITAT | 193.8 | 232.8 | 181.2 | 323.5 | 338.9 | 305.1 | 331.6 | 360.3 | 391.6 | 425.6 |
| Depreciation | ||||||||||
| Changes in Account Receivables | ||||||||||
| Changes in Inventories | ||||||||||
| Changes in Accounts Payable | ||||||||||
| Capital Expenditure | ||||||||||
| UFCF | -341.4 | -10.2 | -101.3 | 292.2 | 402.8 | 99.4 | 154.7 | 168.1 | 182.7 | 198.6 |
| WACC, % | 6.01 | 6.06 | 6.05 | 6.23 | 6.17 | 6.11 | 6.11 | 6.11 | 6.11 | 6.11 |
| PV UFCF | ||||||||||
| SUM PV UFCF | 663.6 | |||||||||
| Long Term Growth Rate, % | 2.00 | |||||||||
| Free cash flow (T + 1) | 203 | |||||||||
| Terminal Value | 4,933 | |||||||||
| Present Terminal Value | 3,668 | |||||||||
| Enterprise Value | 4,331 | |||||||||
| Net Debt | 1,247 | |||||||||
| Equity Value | 3,084 | |||||||||
| Diluted Shares Outstanding, MM | 45 | |||||||||
| Equity Value Per Share | 68.89 |
Benefits of Choosing Vicat S.A. (VCTPA)
- Comprehensive VCTPA Financial Data: Pre-loaded with Vicat’s historical and forecasted figures for accurate assessments.
- Customizable Template: Easily adjust essential inputs such as revenue growth, WACC, and EBITDA percentage.
- Instant Calculations: Watch as Vicat’s intrinsic value updates in real-time with your adjustments.
- Expert Valuation Tool: Tailored for investors, analysts, and consultants aiming for reliable DCF outcomes.
- Intuitive Interface: Simplified layout and clear guidance suitable for all skill levels.
Key Features
- Comprehensive DCF Calculator: Features detailed unlevered and levered DCF valuation models tailored for Vicat S.A. (VCTPA).
- Weighted Average Cost of Capital (WACC) Calculator: Offers a pre-configured WACC sheet with customizable parameters.
- Customizable Forecast Assumptions: Adjust growth rates, capital expenditures, and discount rates to fit your analysis.
- Integrated Financial Ratios: Evaluate profitability, leverage, and efficiency ratios specifically for Vicat S.A. (VCTPA).
- User-Friendly Dashboard and Charts: Visual representations of key valuation metrics for straightforward analysis.
How It Works
- Step 1: Download the Excel file for Vicat S.A. (VCTPA).
- Step 2: Examine the pre-filled financial data and forecasts for Vicat S.A. (VCTPA).
- Step 3: Adjust key inputs such as revenue growth, WACC, and tax rates (highlighted cells).
- Step 4: Observe the DCF model update in real-time as you modify your assumptions.
- Step 5: Evaluate the outputs and leverage the findings for your investment decisions.
Why Select the Vicat Calculator?
- Precision: Utilizes genuine Vicat financial data for reliable results.
- Versatility: Crafted to allow users to experiment with and adjust inputs effortlessly.
- Efficiency: Eliminate the need to create a DCF model from the ground up.
- Expert-Level: Built with the accuracy and functionality that meets CFO standards.
- Accessible: Intuitive design makes it suitable for users without extensive financial modeling skills.
Who Can Benefit from This Product?
- Institutional Investors: Develop comprehensive and accurate valuation models for assessing their portfolio.
- Corporate Finance Teams: Evaluate various valuation scenarios to inform strategic decisions.
- Consultants and Financial Advisors: Equip clients with reliable valuation insights for Vicat S.A. (VCTPA) stock.
- Students and Educators: Utilize real-world data to enhance learning and practice in financial modeling.
- Cement Industry Enthusiasts: Gain insights into how companies like Vicat S.A. (VCTPA) are valued in the industry.
Contents of the Template
- Pre-Filled Data: Contains Vicat S.A.’s historical financial performance and forecasts.
- Discounted Cash Flow Model: Editable DCF valuation model with automatic computations.
- Weighted Average Cost of Capital (WACC): A dedicated section for WACC calculations based on user-defined inputs.
- Key Financial Ratios: Evaluate Vicat S.A.’s profitability, efficiency, and leverage.
- Customizable Inputs: Easily adjust revenue growth, profit margins, and tax rates.
- User-Friendly Dashboard: Visuals and tables that summarize essential valuation results.
Disclaimer
All information, articles, and product details provided on this website are for general informational and educational purposes only. We do not claim any ownership over, nor do we intend to infringe upon, any trademarks, copyrights, logos, brand names, or other intellectual property mentioned or depicted on this site. Such intellectual property remains the property of its respective owners, and any references here are made solely for identification or informational purposes, without implying any affiliation, endorsement, or partnership.
We make no representations or warranties, express or implied, regarding the accuracy, completeness, or suitability of any content or products presented. Nothing on this website should be construed as legal, tax, investment, financial, medical, or other professional advice. In addition, no part of this site—including articles or product references—constitutes a solicitation, recommendation, endorsement, advertisement, or offer to buy or sell any securities, franchises, or other financial instruments, particularly in jurisdictions where such activity would be unlawful.
All content is of a general nature and may not address the specific circumstances of any individual or entity. It is not a substitute for professional advice or services. Any actions you take based on the information provided here are strictly at your own risk. You accept full responsibility for any decisions or outcomes arising from your use of this website and agree to release us from any liability in connection with your use of, or reliance upon, the content or products found herein.