
|
Veeco Instruments Inc. (VECO) DCF -Bewertung |
Fully Editable: Tailor To Your Needs In Excel Or Sheets
Professional Design: Trusted, Industry-Standard Templates
Investor-Approved Valuation Models
MAC/PC Compatible, Fully Unlocked
No Expertise Is Needed; Easy To Follow
Veeco Instruments Inc. (VECO) Bundle
Bewerten Sie die finanziellen Aussichten von Veeco Instruments Inc. wie ein Fachmann! Dieser (VECO) DCF-Taschenrechner liefert vorgefüllte Finanzdaten und ermöglicht Ihnen die Flexibilität, das Umsatzwachstum, WACC, Margen und andere wesentliche Annahmen zu ändern, um sich an Ihren Projektionen anzupassen.
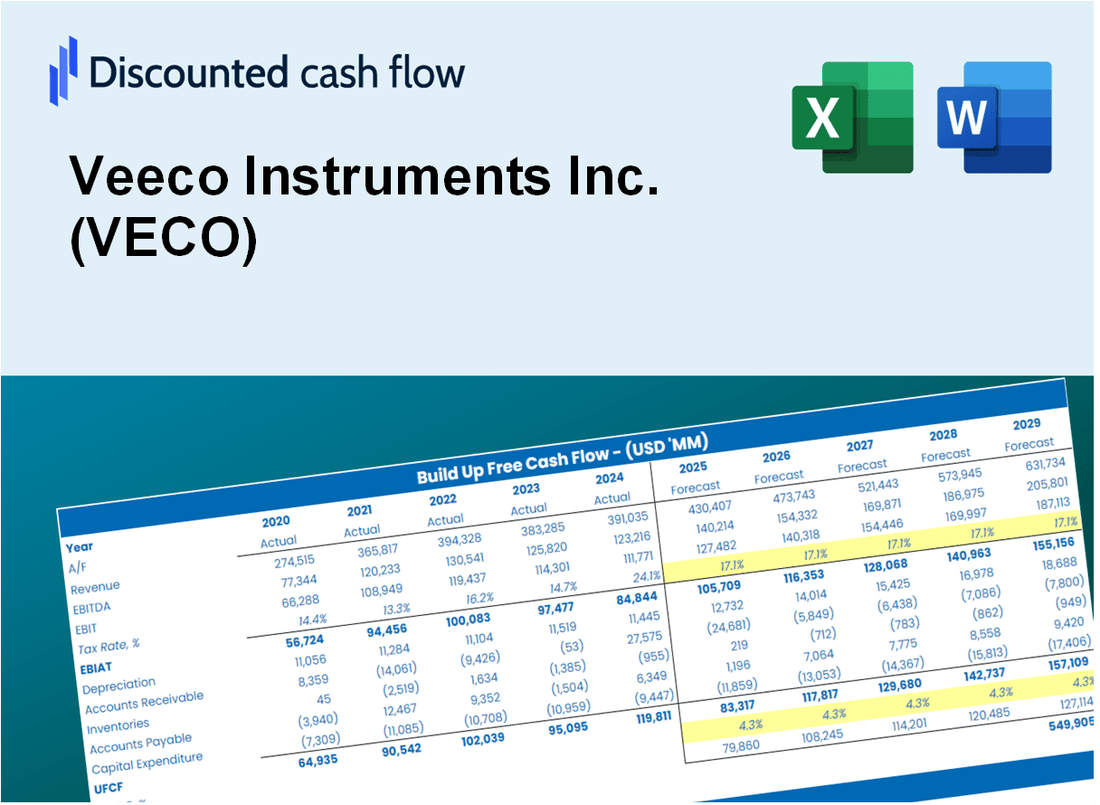
Discounted Cash Flow (DCF) - (USD MM)
| Year | AY1 2020 |
AY2 2021 |
AY3 2022 |
AY4 2023 |
AY5 2024 |
FY1 2025 |
FY2 2026 |
FY3 2027 |
FY4 2028 |
FY5 2029 |
|---|---|---|---|---|---|---|---|---|---|---|
| Revenue | 454.2 | 583.3 | 646.1 | 666.4 | 717.3 | 806.9 | 907.8 | 1,021.2 | 1,148.8 | 1,292.3 |
| Revenue Growth, % | 0 | 28.43 | 10.78 | 3.14 | 7.63 | 12.5 | 12.5 | 12.5 | 12.5 | 12.5 |
| EBITDA | 47.0 | 82.8 | 88.1 | 8.4 | 105.0 | 87.3 | 98.2 | 110.4 | 124.2 | 139.8 |
| EBITDA, % | 10.34 | 14.19 | 13.64 | 1.26 | 14.64 | 10.82 | 10.82 | 10.82 | 10.82 | 10.82 |
| Depreciation | 30.7 | 26.1 | 25.6 | 25.0 | 25.1 | 36.2 | 40.8 | 45.8 | 51.6 | 58.0 |
| Depreciation, % | 6.76 | 4.47 | 3.97 | 3.75 | 3.51 | 4.49 | 4.49 | 4.49 | 4.49 | 4.49 |
| EBIT | 16.3 | 56.7 | 62.5 | -16.6 | 79.9 | 51.0 | 57.4 | 64.6 | 72.7 | 81.7 |
| EBIT, % | 3.58 | 9.72 | 9.67 | -2.49 | 11.14 | 6.33 | 6.33 | 6.33 | 6.33 | 6.33 |
| Total Cash | 319.4 | 223.9 | 302.4 | 305.4 | 344.3 | 402.4 | 452.7 | 509.3 | 572.9 | 644.5 |
| Total Cash, percent | .0 | .0 | .0 | .0 | .0 | .0 | .0 | .0 | .0 | .0 |
| Account Receivables | 101.2 | 127.9 | 140.7 | 127.4 | 133.9 | 167.5 | 188.4 | 212.0 | 238.5 | 268.3 |
| Account Receivables, % | 22.29 | 21.93 | 21.78 | 19.11 | 18.67 | 20.76 | 20.76 | 20.76 | 20.76 | 20.76 |
| Inventories | 145.9 | 170.9 | 206.9 | 237.6 | 246.7 | 263.9 | 296.8 | 333.9 | 375.6 | 422.6 |
| Inventories, % | 32.13 | 29.29 | 32.02 | 35.66 | 34.4 | 32.7 | 32.7 | 32.7 | 32.7 | 32.7 |
| Accounts Payable | 33.7 | 44.5 | 52.0 | 42.4 | 43.5 | 57.3 | 64.5 | 72.5 | 81.6 | 91.8 |
| Accounts Payable, % | 7.41 | 7.62 | 8.06 | 6.36 | 6.07 | 7.1 | 7.1 | 7.1 | 7.1 | 7.1 |
| Capital Expenditure | -6.8 | -40.6 | -24.6 | -27.9 | -18.1 | -30.6 | -34.5 | -38.8 | -43.6 | -49.1 |
| Capital Expenditure, % | -1.5 | -6.97 | -3.81 | -4.19 | -2.53 | -3.8 | -3.8 | -3.8 | -3.8 | -3.8 |
| Tax Rate, % | -7.09 | -7.09 | -7.09 | -7.09 | -7.09 | -7.09 | -7.09 | -7.09 | -7.09 | -7.09 |
| EBITAT | 16.1 | 57.5 | 204.6 | -17.8 | 85.5 | 51.0 | 57.3 | 64.5 | 72.5 | 81.6 |
| Depreciation | ||||||||||
| Changes in Account Receivables | ||||||||||
| Changes in Inventories | ||||||||||
| Changes in Accounts Payable | ||||||||||
| Capital Expenditure | ||||||||||
| UFCF | -173.5 | 2.1 | 164.4 | -47.8 | 78.1 | 19.7 | 16.9 | 19.0 | 21.3 | 24.0 |
| WACC, % | 8.42 | 8.42 | 8.42 | 8.42 | 8.42 | 8.42 | 8.42 | 8.42 | 8.42 | 8.42 |
| PV UFCF | ||||||||||
| SUM PV UFCF | 78.8 | |||||||||
| Long Term Growth Rate, % | 4.00 | |||||||||
| Free cash flow (T + 1) | 25 | |||||||||
| Terminal Value | 564 | |||||||||
| Present Terminal Value | 377 | |||||||||
| Enterprise Value | 455 | |||||||||
| Net Debt | 169 | |||||||||
| Equity Value | 287 | |||||||||
| Diluted Shares Outstanding, MM | 62 | |||||||||
| Equity Value Per Share | 4.66 |
What You Will Get
- Real VECO Financial Data: Pre-filled with Veeco Instruments Inc.’s historical and projected data for precise analysis.
- Fully Editable Template: Modify key inputs like revenue growth, WACC, and EBITDA % with ease.
- Automatic Calculations: See Veeco Instruments Inc.’s intrinsic value update instantly based on your changes.
- Professional Valuation Tool: Designed for investors, analysts, and consultants seeking accurate DCF results.
- User-Friendly Design: Simple structure and clear instructions for all experience levels.
Key Features
- Comprehensive Financial Data: Gain access to accurate historical data and future projections tailored for Veeco Instruments Inc. (VECO).
- Adjustable Forecast Parameters: Modify highlighted cells to customize assumptions like WACC, growth rates, and profit margins.
- Real-Time Calculations: Enjoy automatic updates for DCF, Net Present Value (NPV), and cash flow analysis.
- Interactive Dashboard: Utilize user-friendly charts and summaries to visualize your valuation findings.
- Suitable for All Levels: Designed with a straightforward layout for investors, CFOs, and consultants alike.
How It Works
- Download: Obtain the ready-to-use Excel file containing Veeco Instruments Inc.'s (VECO) financial data.
- Customize: Modify projections, such as revenue growth, EBITDA %, and WACC.
- Update Automatically: The intrinsic value and NPV calculations refresh in real-time.
- Test Scenarios: Develop various projections and instantly compare results.
- Make Decisions: Leverage the valuation outcomes to inform your investment strategy.
Why Choose This Calculator for Veeco Instruments Inc. (VECO)?
- Accurate Data: Access real Veeco financials for dependable valuation outcomes.
- Customizable: Tailor essential parameters like growth rates, WACC, and tax rates to align with your forecasts.
- Time-Saving: Ready-made calculations save you from starting from ground zero.
- Professional-Grade Tool: Crafted for investors, analysts, and consultants in the field.
- User-Friendly: An intuitive design and clear instructions make it accessible for all users.
Who Should Use This Product?
- Investors: Accurately assess Veeco Instruments Inc.’s (VECO) fair value prior to making investment choices.
- CFOs: Utilize a top-tier DCF model for comprehensive financial reporting and analysis.
- Consultants: Efficiently customize the template for client valuation reports.
- Entrepreneurs: Acquire knowledge on financial modeling practices employed by leading technology firms.
- Educators: Implement it as a resource for teaching valuation techniques.
What the Template Contains
- Historical Data: Includes Veeco Instruments Inc.'s (VECO) past financials and baseline forecasts.
- DCF and Levered DCF Models: Detailed templates to calculate Veeco Instruments Inc.'s (VECO) intrinsic value.
- WACC Sheet: Pre-built calculations for Weighted Average Cost of Capital.
- Editable Inputs: Modify key drivers like growth rates, EBITDA %, and CAPEX assumptions.
- Quarterly and Annual Statements: A complete breakdown of Veeco Instruments Inc.'s (VECO) financials.
- Interactive Dashboard: Visualize valuation results and projections dynamically.
Disclaimer
All information, articles, and product details provided on this website are for general informational and educational purposes only. We do not claim any ownership over, nor do we intend to infringe upon, any trademarks, copyrights, logos, brand names, or other intellectual property mentioned or depicted on this site. Such intellectual property remains the property of its respective owners, and any references here are made solely for identification or informational purposes, without implying any affiliation, endorsement, or partnership.
We make no representations or warranties, express or implied, regarding the accuracy, completeness, or suitability of any content or products presented. Nothing on this website should be construed as legal, tax, investment, financial, medical, or other professional advice. In addition, no part of this site—including articles or product references—constitutes a solicitation, recommendation, endorsement, advertisement, or offer to buy or sell any securities, franchises, or other financial instruments, particularly in jurisdictions where such activity would be unlawful.
All content is of a general nature and may not address the specific circumstances of any individual or entity. It is not a substitute for professional advice or services. Any actions you take based on the information provided here are strictly at your own risk. You accept full responsibility for any decisions or outcomes arising from your use of this website and agree to release us from any liability in connection with your use of, or reliance upon, the content or products found herein.