
|
Vera Therapeutics, Inc. (Vera) DCF -Bewertung |
Fully Editable: Tailor To Your Needs In Excel Or Sheets
Professional Design: Trusted, Industry-Standard Templates
Investor-Approved Valuation Models
MAC/PC Compatible, Fully Unlocked
No Expertise Is Needed; Easy To Follow
Vera Therapeutics, Inc. (VERA) Bundle
Erforschen Sie das finanzielle Potenzial von Vera Therapeutics, Inc. (Vera) mit unserem benutzerfreundlichen DCF-Taschenrechner! Geben Sie Ihre Prognosen für Wachstum, Gewinnmargen und Ausgaben ein, um den inneren Wert von Vera Therapeutics, Inc. (Vera) zu berechnen und Ihren Investitionsansatz zu verbessern.
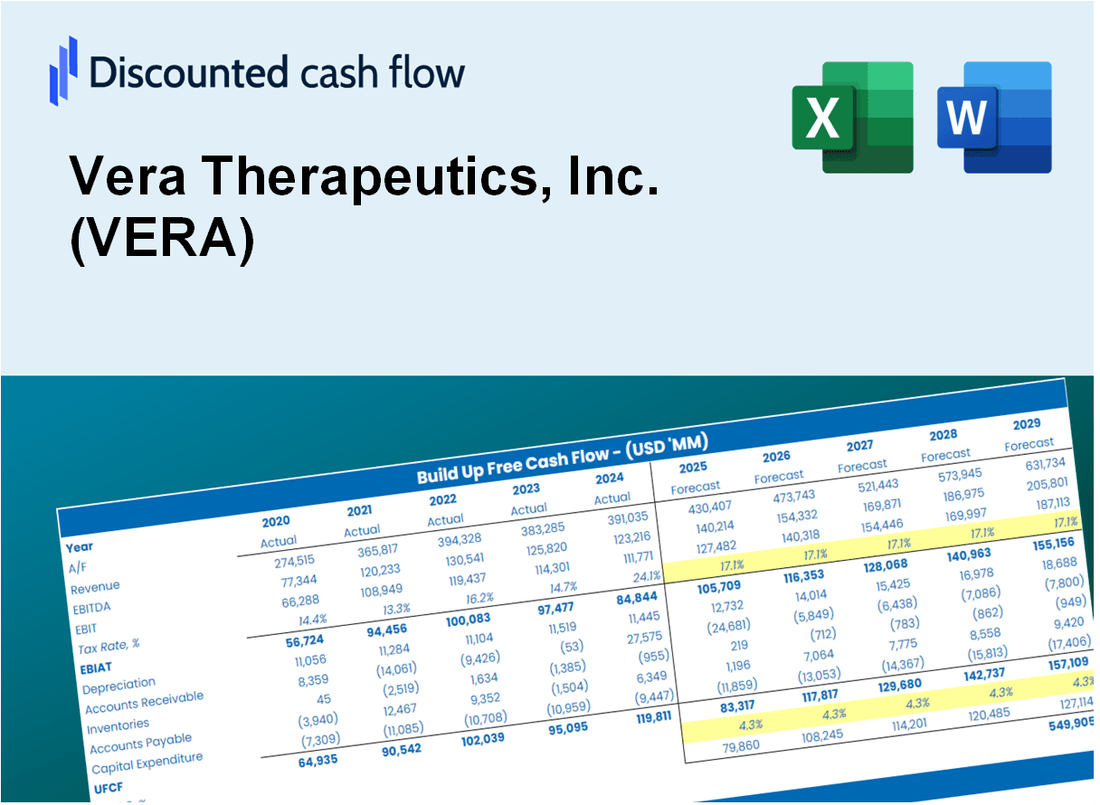
Discounted Cash Flow (DCF) - (USD MM)
| Year | AY1 2020 |
AY2 2021 |
AY3 2022 |
AY4 2023 |
AY5 2024 |
FY1 2025 |
FY2 2026 |
FY3 2027 |
FY4 2028 |
FY5 2029 |
|---|---|---|---|---|---|---|---|---|---|---|
| Revenue | .0 | .0 | .0 | 1.9 | .0 | .0 | .0 | .0 | .0 | .0 |
| Revenue Growth, % | 0 | 0 | 0 | 0 | -100 | -25 | -25 | -25 | -25 | -25 |
| EBITDA | -53.0 | -34.2 | -90.9 | -102.0 | -167.2 | .0 | .0 | .0 | .0 | .0 |
| EBITDA, % | 100 | 100 | 100 | -5478.63 | 100 | 60 | 60 | 60 | 60 | 60 |
| Depreciation | .3 | .2 | -.8 | .0 | -7.4 | .0 | .0 | .0 | .0 | .0 |
| Depreciation, % | 100 | 100 | 100 | 0 | 100 | 80 | 80 | 80 | 80 | 80 |
| EBIT | -53.2 | -34.4 | -90.1 | -102.0 | -159.8 | .0 | .0 | .0 | .0 | .0 |
| EBIT, % | 100 | 100 | 100 | -5478.63 | 100 | 60 | 60 | 60 | 60 | 60 |
| Total Cash | 53.7 | 79.7 | 114.7 | 160.7 | 640.9 | .0 | .0 | .0 | .0 | .0 |
| Total Cash, percent | .0 | .0 | .0 | .0 | .0 | .0 | .0 | .0 | .0 | .0 |
| Account Receivables | .1 | .0 | .0 | .0 | 3.8 | .0 | .0 | .0 | .0 | .0 |
| Account Receivables, % | 100 | 100 | 100 | 0 | 100 | 80 | 80 | 80 | 80 | 80 |
| Inventories | .5 | .0 | .0 | .0 | .0 | .0 | .0 | .0 | .0 | .0 |
| Inventories, % | 100 | 100 | 100 | 0 | 100 | 80 | 80 | 80 | 80 | 80 |
| Accounts Payable | .9 | 1.4 | 12.0 | 11.1 | 7.7 | .0 | .0 | .0 | .0 | .0 |
| Accounts Payable, % | 100 | 100 | 100 | 597.1 | 100 | 100 | 100 | 100 | 100 | 100 |
| Capital Expenditure | -.1 | .0 | -.1 | -.1 | -1.0 | .0 | .0 | .0 | .0 | .0 |
| Capital Expenditure, % | 100 | 100 | 100 | -3.38 | 100 | -0.67669 | -0.67669 | -0.67669 | -0.67669 | -0.67669 |
| Tax Rate, % | -0.000657259098 | -0.000657259098 | -0.000657259098 | -0.000657259098 | -0.000657259098 | -0.000657259098 | -0.000657259098 | -0.000657259098 | -0.000657259098 | -0.000657259098 |
| EBITAT | -53.2 | -34.4 | -90.1 | -102.0 | -159.8 | .0 | .0 | .0 | .0 | .0 |
| Depreciation | ||||||||||
| Changes in Account Receivables | ||||||||||
| Changes in Inventories | ||||||||||
| Changes in Accounts Payable | ||||||||||
| Capital Expenditure | ||||||||||
| UFCF | -52.7 | -33.2 | -80.4 | -102.9 | -175.4 | -3.9 | .0 | .0 | .0 | .0 |
| WACC, % | 9.65 | 9.65 | 9.65 | 9.65 | 9.65 | 9.65 | 9.65 | 9.65 | 9.65 | 9.65 |
| PV UFCF | ||||||||||
| SUM PV UFCF | -3.5 | |||||||||
| Long Term Growth Rate, % | 2.00 | |||||||||
| Free cash flow (T + 1) | 0 | |||||||||
| Terminal Value | 0 | |||||||||
| Present Terminal Value | 0 | |||||||||
| Enterprise Value | -4 | |||||||||
| Net Debt | -38 | |||||||||
| Equity Value | 34 | |||||||||
| Diluted Shares Outstanding, MM | 55 | |||||||||
| Equity Value Per Share | 0.62 |
What You Will Get
- Comprehensive VERA Financials: Access to both historical and projected data for precise valuation.
- Customizable Inputs: Adjust variables such as WACC, tax rates, revenue growth, and capital expenditures.
- Dynamic Calculations: Intrinsic value and NPV are computed in real-time.
- Scenario Analysis: Evaluate various scenarios to assess Vera Therapeutics' future performance.
- User-Friendly Design: Designed for industry professionals while remaining approachable for newcomers.
Key Features
- 🔍 Real-Life VERA Financials: Pre-filled historical and projected data for Vera Therapeutics, Inc. (VERA).
- ✏️ Fully Customizable Inputs: Adjust all critical parameters (yellow cells) like WACC, growth %, and tax rates.
- 📊 Professional DCF Valuation: Built-in formulas calculate Vera’s intrinsic value using the Discounted Cash Flow method.
- ⚡ Instant Results: Visualize Vera’s valuation instantly after making changes.
- Scenario Analysis: Test and compare outcomes for various financial assumptions side-by-side.
How It Works
- 1. Access the Model: Download and open the Excel file containing Vera Therapeutics, Inc. (VERA) financial data.
- 2. Adjust Key Inputs: Modify essential parameters such as revenue projections, discount rates, and operating expenses.
- 3. Analyze Results in Real-Time: The DCF model automatically computes the intrinsic value and net present value (NPV).
- 4. Explore Different Scenarios: Evaluate various forecasts to understand potential valuation impacts.
- 5. Make Informed Decisions: Share expert valuation findings to enhance your investment strategies.
Why Choose Vera Therapeutics, Inc. (VERA)?
- Innovative Solutions: Pioneering therapies that address unmet medical needs in patients.
- Expert Team: Led by industry veterans with extensive experience in biotechnology.
- Robust Pipeline: A diverse range of promising drug candidates in various stages of development.
- Commitment to Quality: Adherence to the highest standards in research and clinical trials.
- Positive Impact: Focused on improving patient outcomes and enhancing quality of life.
Who Should Use Vera Therapeutics, Inc. (VERA)?
- Healthcare Investors: Make informed investment choices with insights from a leading biotech firm.
- Pharmaceutical Analysts: Streamline your evaluations with comprehensive data on drug development and clinical trials.
- Consultants: Easily tailor reports and presentations for clients focused on the biotech sector.
- Biotech Enthusiasts: Enhance your knowledge of therapeutic innovations and market trends with real case studies.
- Educators and Students: Utilize it as a valuable resource in life sciences and healthcare courses.
What the Template Contains
- Preloaded VERA Data: Historical and projected financial data, including revenue, EBIT, and capital expenditures.
- DCF and WACC Models: Professional-grade sheets for calculating intrinsic value and Weighted Average Cost of Capital.
- Editable Inputs: Yellow-highlighted cells for adjusting revenue growth, tax rates, and discount rates.
- Financial Statements: Comprehensive annual and quarterly financials for deeper analysis.
- Key Ratios: Profitability, leverage, and efficiency ratios to evaluate performance.
- Dashboard and Charts: Visual summaries of valuation outcomes and assumptions.
Disclaimer
All information, articles, and product details provided on this website are for general informational and educational purposes only. We do not claim any ownership over, nor do we intend to infringe upon, any trademarks, copyrights, logos, brand names, or other intellectual property mentioned or depicted on this site. Such intellectual property remains the property of its respective owners, and any references here are made solely for identification or informational purposes, without implying any affiliation, endorsement, or partnership.
We make no representations or warranties, express or implied, regarding the accuracy, completeness, or suitability of any content or products presented. Nothing on this website should be construed as legal, tax, investment, financial, medical, or other professional advice. In addition, no part of this site—including articles or product references—constitutes a solicitation, recommendation, endorsement, advertisement, or offer to buy or sell any securities, franchises, or other financial instruments, particularly in jurisdictions where such activity would be unlawful.
All content is of a general nature and may not address the specific circumstances of any individual or entity. It is not a substitute for professional advice or services. Any actions you take based on the information provided here are strictly at your own risk. You accept full responsibility for any decisions or outcomes arising from your use of this website and agree to release us from any liability in connection with your use of, or reliance upon, the content or products found herein.