
|
Vesuvid India Limited (Vesuv.NS) DCF -Bewertung |
Fully Editable: Tailor To Your Needs In Excel Or Sheets
Professional Design: Trusted, Industry-Standard Templates
Investor-Approved Valuation Models
MAC/PC Compatible, Fully Unlocked
No Expertise Is Needed; Easy To Follow
Vesuvius India Limited (VESUVIUS.NS) Bundle
Bewerten Sie den finanziellen Ausblick von Vesuvid India Limited wie ein Experte! Dieser (Vesuviusns) DCF-Taschenrechner verfügt über vorgefüllte Finanzdaten und bietet Ihnen die Flexibilität, das Umsatzwachstum, WACC, Margen und andere wesentliche Annahmen für Ihre Projektionen zu ändern.
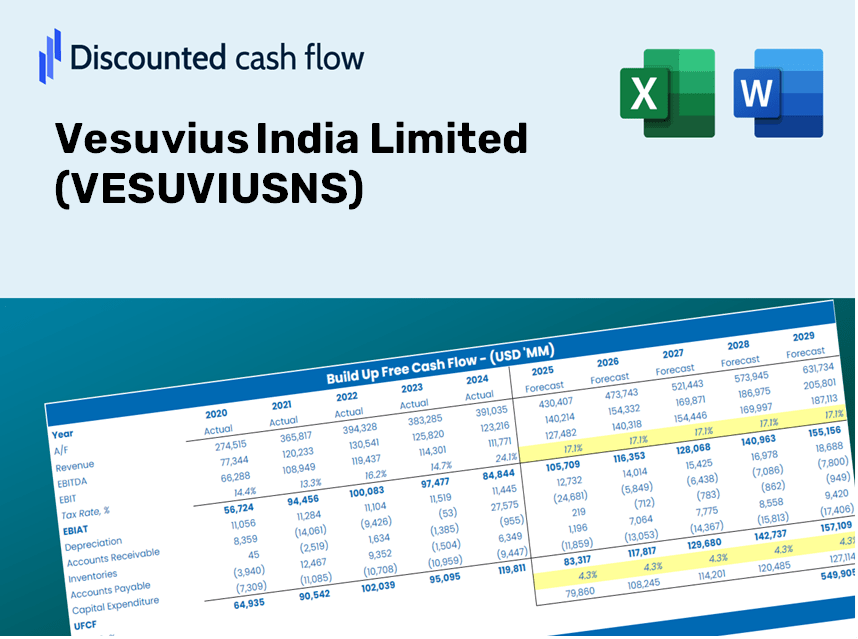
Discounted Cash Flow (DCF) - (USD MM)
| Year | AY1 2020 |
AY2 2021 |
AY3 2022 |
AY4 2023 |
AY5 2024 |
FY1 2025 |
FY2 2026 |
FY3 2027 |
FY4 2028 |
FY5 2029 |
|---|---|---|---|---|---|---|---|---|---|---|
| Revenue | 7,873.1 | 10,471.6 | 13,352.1 | 16,031.3 | 18,649.7 | 23,168.1 | 28,781.3 | 35,754.3 | 44,416.8 | 55,178.1 |
| Revenue Growth, % | 0 | 33 | 27.51 | 20.07 | 16.33 | 24.23 | 24.23 | 24.23 | 24.23 | 24.23 |
| EBITDA | 977.9 | 1,189.0 | 1,876.2 | 3,235.6 | 3,985.3 | 3,678.1 | 4,569.3 | 5,676.3 | 7,051.6 | 8,760.0 |
| EBITDA, % | 12.42 | 11.35 | 14.05 | 20.18 | 21.37 | 15.88 | 15.88 | 15.88 | 15.88 | 15.88 |
| Depreciation | 262.4 | 273.4 | 298.6 | 359.2 | 458.5 | 596.8 | 741.4 | 921.0 | 1,144.1 | 1,421.3 |
| Depreciation, % | 3.33 | 2.61 | 2.24 | 2.24 | 2.46 | 2.58 | 2.58 | 2.58 | 2.58 | 2.58 |
| EBIT | 715.5 | 915.6 | 1,577.6 | 2,876.4 | 3,526.8 | 3,081.4 | 3,827.9 | 4,755.3 | 5,907.4 | 7,338.7 |
| EBIT, % | 9.09 | 8.74 | 11.82 | 17.94 | 18.91 | 13.3 | 13.3 | 13.3 | 13.3 | 13.3 |
| Total Cash | 5,587.5 | 5,533.8 | 5,674.0 | 4,647.6 | 4,814.2 | 10,245.6 | 12,727.9 | 15,811.6 | 19,642.5 | 24,401.4 |
| Total Cash, percent | .0 | .0 | .0 | .0 | .0 | .0 | .0 | .0 | .0 | .0 |
| Account Receivables | 1,633.9 | 1,698.4 | 2,093.6 | 3,305.9 | 3,941.0 | 4,374.4 | 5,434.2 | 6,750.8 | 8,386.4 | 10,418.2 |
| Account Receivables, % | 20.75 | 16.22 | 15.68 | 20.62 | 21.13 | 18.88 | 18.88 | 18.88 | 18.88 | 18.88 |
| Inventories | 1,169.6 | 2,244.2 | 2,048.2 | 2,575.1 | 2,477.1 | 3,751.9 | 4,661.0 | 5,790.2 | 7,193.0 | 8,935.8 |
| Inventories, % | 14.86 | 21.43 | 15.34 | 16.06 | 13.28 | 16.19 | 16.19 | 16.19 | 16.19 | 16.19 |
| Accounts Payable | 1,574.5 | 2,226.8 | 2,461.7 | 2,881.7 | 2,969.1 | 4,336.9 | 5,387.6 | 6,692.9 | 8,314.5 | 10,328.9 |
| Accounts Payable, % | 20 | 21.27 | 18.44 | 17.98 | 15.92 | 18.72 | 18.72 | 18.72 | 18.72 | 18.72 |
| Capital Expenditure | -151.7 | -319.5 | -1,129.0 | -1,998.1 | -2,421.9 | -1,801.7 | -2,238.2 | -2,780.5 | -3,454.2 | -4,291.0 |
| Capital Expenditure, % | -1.93 | -3.05 | -8.46 | -12.46 | -12.99 | -7.78 | -7.78 | -7.78 | -7.78 | -7.78 |
| Tax Rate, % | 24.17 | 24.17 | 24.17 | 24.17 | 24.17 | 24.17 | 24.17 | 24.17 | 24.17 | 24.17 |
| EBITAT | 530.5 | 680.5 | 1,174.6 | 2,146.1 | 2,674.3 | 2,300.9 | 2,858.4 | 3,550.9 | 4,411.2 | 5,480.0 |
| Depreciation | ||||||||||
| Changes in Account Receivables | ||||||||||
| Changes in Inventories | ||||||||||
| Changes in Accounts Payable | ||||||||||
| Capital Expenditure | ||||||||||
| UFCF | -587.8 | 147.6 | 379.9 | -812.0 | 261.2 | 755.6 | 443.4 | 550.8 | 684.3 | 850.1 |
| WACC, % | 4.9 | 4.9 | 4.9 | 4.9 | 4.9 | 4.9 | 4.9 | 4.9 | 4.9 | 4.9 |
| PV UFCF | ||||||||||
| SUM PV UFCF | 2,834.8 | |||||||||
| Long Term Growth Rate, % | 4.00 | |||||||||
| Free cash flow (T + 1) | 884 | |||||||||
| Terminal Value | 98,243 | |||||||||
| Present Terminal Value | 77,344 | |||||||||
| Enterprise Value | 80,179 | |||||||||
| Net Debt | -1,449 | |||||||||
| Equity Value | 81,628 | |||||||||
| Diluted Shares Outstanding, MM | 203 | |||||||||
| Equity Value Per Share | 402.19 |
Your Benefits
- Genuine VESUVIUSNS Financials: Access historical and projected data for precise valuation.
- Customizable Parameters: Adjust WACC, tax rates, revenue growth, and capital investments as needed.
- Instant Calculations: Intrinsic value and NPV are computed in real-time.
- Scenario Simulation: Analyze various scenarios to assess Vesuvius India's potential future performance.
- User-Friendly and Intuitive Layout: Designed for industry professionals while remaining approachable for newcomers.
Key Features
- Authentic Vesuvius Financial Data: Gain access to precise historical data and forward-looking projections tailored for Vesuvius India Limited (VESUVIUSNS).
- Adjustable Forecast Variables: Modify highlighted cells such as WACC, growth percentages, and profit margins as needed.
- Real-Time Calculations: Automatic updates for DCF, Net Present Value (NPV), and comprehensive cash flow analysis.
- User-Friendly Dashboard: Clear, visual charts and summaries to effectively present your valuation findings.
- Designed for All Skill Levels: An intuitive layout catering to investors, CFOs, and consultants, whether experienced or new.
How It Operates
- 1. Access the Template: Download and open the Excel file containing Vesuvius India Limited’s (VESUVIUSNS) preloaded data.
- 2. Modify Assumptions: Adjust critical inputs such as growth projections, WACC, and capital expenditures.
- 3. View Instant Results: The DCF model automatically computes intrinsic value and NPV in real-time.
- 4. Evaluate Scenarios: Assess various forecasts to explore different valuation possibilities.
- 5. Present with Assurance: Deliver expert valuation insights to bolster your decision-making process.
Why Opt for This Calculator?
- All-in-One Solution: Features DCF, WACC, and financial ratio analyses bundled together.
- Adjustable Parameters: Modify inputs in yellow-highlighted cells to explore different scenarios.
- In-Depth Analysis: Automatically computes the intrinsic value and Net Present Value for Vesuvius India Limited (VESUVIUSNS).
- Preloaded Information: Comes with historical and projected data for reliable baseline measurements.
- High-Quality Standards: Perfect for financial analysts, investors, and business consultants alike.
Who Can Benefit from This Product?
- Investors: Assess the valuation of Vesuvius India Limited (VESUVIUSNS) prior to making investment decisions.
- CFOs and Financial Analysts: Enhance valuation workflows and validate financial forecasts.
- Startup Founders: Understand the valuation methods applied to established firms like Vesuvius India Limited (VESUVIUSNS).
- Consultants: Provide comprehensive valuation reports for clients leveraging Vesuvius India Limited (VESUVIUSNS) insights.
- Students and Educators: Utilize practical data to learn and instruct on valuation strategies.
Contents of the Template
- Operating and Balance Sheet Data: Pre-filled historical data and forecasts for Vesuvius India Limited (VESUVIUSNS), covering metrics such as revenue, EBITDA, EBIT, and capital expenditures.
- WACC Calculation: A dedicated section for calculating the Weighted Average Cost of Capital (WACC), incorporating key parameters like Beta, risk-free rate, and share price.
- DCF Valuation (Unlevered and Levered): Customizable Discounted Cash Flow models presenting intrinsic value with comprehensive calculations.
- Financial Statements: Pre-loaded financial statements (both annual and quarterly) to facilitate thorough analysis.
- Key Ratios: A collection of important ratios, including profitability, leverage, and efficiency metrics for Vesuvius India Limited (VESUVIUSNS).
- Dashboard and Charts: A visual overview of valuation results and underlying assumptions for easier analysis.
Disclaimer
All information, articles, and product details provided on this website are for general informational and educational purposes only. We do not claim any ownership over, nor do we intend to infringe upon, any trademarks, copyrights, logos, brand names, or other intellectual property mentioned or depicted on this site. Such intellectual property remains the property of its respective owners, and any references here are made solely for identification or informational purposes, without implying any affiliation, endorsement, or partnership.
We make no representations or warranties, express or implied, regarding the accuracy, completeness, or suitability of any content or products presented. Nothing on this website should be construed as legal, tax, investment, financial, medical, or other professional advice. In addition, no part of this site—including articles or product references—constitutes a solicitation, recommendation, endorsement, advertisement, or offer to buy or sell any securities, franchises, or other financial instruments, particularly in jurisdictions where such activity would be unlawful.
All content is of a general nature and may not address the specific circumstances of any individual or entity. It is not a substitute for professional advice or services. Any actions you take based on the information provided here are strictly at your own risk. You accept full responsibility for any decisions or outcomes arising from your use of this website and agree to release us from any liability in connection with your use of, or reliance upon, the content or products found herein.