
|
Vigil Neuroscience, Inc. (VIGL) DCF -Bewertung |
Fully Editable: Tailor To Your Needs In Excel Or Sheets
Professional Design: Trusted, Industry-Standard Templates
Investor-Approved Valuation Models
MAC/PC Compatible, Fully Unlocked
No Expertise Is Needed; Easy To Follow
Vigil Neuroscience, Inc. (VIGL) Bundle
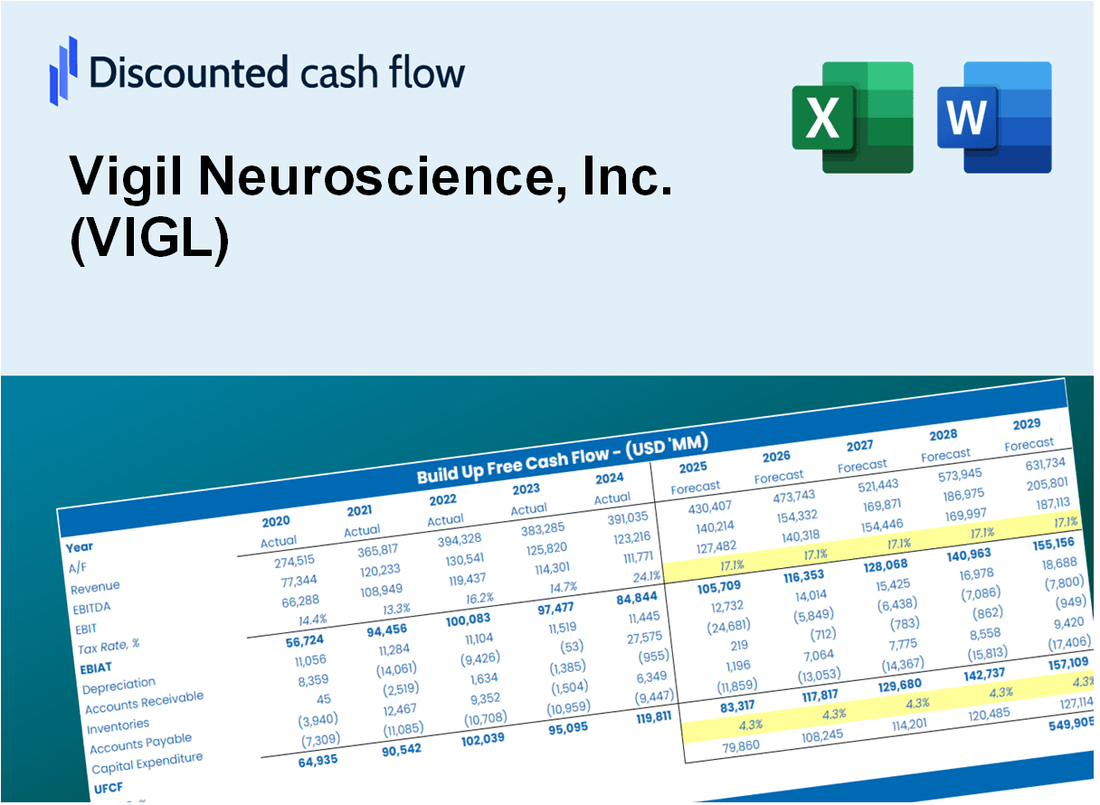
Unabhängig davon, ob Sie ein Investor oder Analyst sind, ist dieser (VIGL) DCF-Taschenrechner Ihre Anlaufstelle für eine genaue Bewertung. Mit realen Daten von Vigil Neuroscience, Inc. geladen, können Sie Prognosen anpassen und die Effekte in Echtzeit beobachten.
Discounted Cash Flow (DCF) - (USD MM)
| Year | AY1 2020 |
AY2 2021 |
AY3 2022 |
AY4 2023 |
AY5 2024 |
FY1 2025 |
FY2 2026 |
FY3 2027 |
FY4 2028 |
FY5 2029 |
|---|---|---|---|---|---|---|---|---|---|---|
| Revenue | .0 | .0 | .0 | .0 | .0 | .0 | .0 | .0 | .0 | .0 |
| Revenue Growth, % | 0 | 0 | 0 | 0 | 0 | 0 | 0 | 0 | 0 | 0 |
| EBITDA | -28.5 | -42.9 | -67.3 | -88.5 | -83.8 | .0 | .0 | .0 | .0 | .0 |
| EBITDA, % | 100 | 100 | 100 | 100 | 100 | 100 | 100 | 100 | 100 | 100 |
| Depreciation | 12.6 | .3 | 1.0 | .4 | .5 | .0 | .0 | .0 | .0 | .0 |
| Depreciation, % | 100 | 100 | 100 | 100 | 100 | 100 | 100 | 100 | 100 | 100 |
| EBIT | -41.1 | -43.3 | -68.3 | -88.9 | -84.3 | .0 | .0 | .0 | .0 | .0 |
| EBIT, % | 100 | 100 | 100 | 100 | 100 | 100 | 100 | 100 | 100 | 100 |
| Total Cash | 24.2 | 91.4 | 186.6 | 117.9 | 97.8 | .0 | .0 | .0 | .0 | .0 |
| Total Cash, percent | .0 | .0 | .0 | .0 | .0 | .0 | .0 | .0 | .0 | .0 |
| Account Receivables | .0 | .0 | .0 | 1.5 | .6 | .0 | .0 | .0 | .0 | .0 |
| Account Receivables, % | 100 | 100 | 100 | 100 | 100 | 100 | 100 | 100 | 100 | 100 |
| Inventories | .0 | .0 | 10.6 | .0 | .0 | .0 | .0 | .0 | .0 | .0 |
| Inventories, % | 100 | 100 | 100 | 100 | 100 | 100 | 100 | 100 | 100 | 100 |
| Accounts Payable | 1.1 | 4.0 | 1.9 | 1.9 | 2.0 | .0 | .0 | .0 | .0 | .0 |
| Accounts Payable, % | 100 | 100 | 100 | 100 | 100 | 100 | 100 | 100 | 100 | 100 |
| Capital Expenditure | -.5 | -.2 | -.9 | -.7 | .0 | .0 | .0 | .0 | .0 | .0 |
| Capital Expenditure, % | 100 | 100 | 100 | 100 | 100 | 0 | 0 | 0 | 0 | 0 |
| Tax Rate, % | 0 | 0 | 0 | 0 | 0 | 0 | 0 | 0 | 0 | 0 |
| EBITAT | -41.1 | -43.3 | -67.7 | -88.9 | -84.3 | .0 | .0 | .0 | .0 | .0 |
| Depreciation | ||||||||||
| Changes in Account Receivables | ||||||||||
| Changes in Inventories | ||||||||||
| Changes in Accounts Payable | ||||||||||
| Capital Expenditure | ||||||||||
| UFCF | -27.9 | -40.2 | -80.2 | -80.1 | -82.9 | -1.4 | .0 | .0 | .0 | .0 |
| WACC, % | 19.18 | 19.18 | 19.18 | 19.18 | 19.18 | 19.18 | 19.18 | 19.18 | 19.18 | 19.18 |
| PV UFCF | ||||||||||
| SUM PV UFCF | -1.1 | |||||||||
| Long Term Growth Rate, % | 2.00 | |||||||||
| Free cash flow (T + 1) | 0 | |||||||||
| Terminal Value | 0 | |||||||||
| Present Terminal Value | 0 | |||||||||
| Enterprise Value | -1 | |||||||||
| Net Debt | -26 | |||||||||
| Equity Value | 25 | |||||||||
| Diluted Shares Outstanding, MM | 41 | |||||||||
| Equity Value Per Share | 0.61 |
What You Will Get
- Editable Forecast Inputs: Easily adjust key assumptions (growth %, margins, WACC) to explore various scenarios.
- Real-World Data: Vigil Neuroscience, Inc.'s (VIGL) financial data pre-filled to kickstart your analysis.
- Automatic DCF Outputs: The template computes Net Present Value (NPV) and intrinsic value automatically.
- Customizable and Professional: A refined Excel model that aligns with your valuation requirements.
- Built for Analysts and Investors: Perfect for evaluating projections, confirming strategies, and enhancing efficiency.
Key Features
- Comprehensive Financial Data: Gain access to precise historical data and future forecasts for Vigil Neuroscience, Inc. (VIGL).
- Adjustable Forecast Parameters: Modify highlighted cells for key metrics such as WACC, growth rates, and profit margins.
- Real-Time Calculations: Automatic updates for DCF, Net Present Value (NPV), and cash flow assessments.
- Interactive Dashboard: User-friendly charts and summaries to effectively visualize your valuation outcomes.
- Designed for All Skill Levels: An intuitive layout tailored for investors, CFOs, and consultants alike.
How It Works
- 1. Access the Template: Download and open the Excel file containing Vigil Neuroscience, Inc.'s preloaded data.
- 2. Modify Assumptions: Adjust key parameters such as growth projections, WACC, and capital expenditures.
- 3. View Results Immediately: The DCF model automatically computes the intrinsic value and NPV.
- 4. Explore Scenarios: Analyze various forecasts to evaluate different valuation results.
- 5. Present with Assurance: Deliver professional valuation insights to back your strategic decisions.
Why Choose Vigil Neuroscience, Inc. (VIGL)?
- Innovative Solutions: Cutting-edge research and therapies aimed at neurological disorders.
- Expert Team: A dedicated group of professionals with extensive experience in neuroscience.
- Strong Pipeline: Promising drug candidates that address unmet medical needs.
- Commitment to Patients: Focused on improving the quality of life for individuals with neurological conditions.
- Proven Track Record: Backed by successful collaborations and partnerships in the biotech industry.
Who Should Use Vigil Neuroscience, Inc. (VIGL)?
- Healthcare Investors: Make informed decisions using advanced analytics tailored for the biotech sector.
- Biotech Analysts: Streamline your research with comprehensive data and insights on VIGL's pipeline.
- Consultants: Easily modify reports and presentations to highlight VIGL's strategic initiatives.
- Science Enthusiasts: Expand your knowledge of neuroscience and biotechnology through real-time updates and case studies.
- Educators and Students: Utilize VIGL as a case study in courses focused on biotechnology and investment strategies.
What the Template Contains
- Preloaded VIGL Data: Historical and projected financial data, including revenue, EBIT, and capital expenditures.
- DCF and WACC Models: Professional-grade sheets for calculating intrinsic value and Weighted Average Cost of Capital.
- Editable Inputs: Yellow-highlighted cells for adjusting revenue growth, tax rates, and discount rates.
- Financial Statements: Comprehensive annual and quarterly financials for deeper analysis.
- Key Ratios: Profitability, leverage, and efficiency ratios to evaluate performance.
- Dashboard and Charts: Visual summaries of valuation outcomes and assumptions.
Disclaimer
All information, articles, and product details provided on this website are for general informational and educational purposes only. We do not claim any ownership over, nor do we intend to infringe upon, any trademarks, copyrights, logos, brand names, or other intellectual property mentioned or depicted on this site. Such intellectual property remains the property of its respective owners, and any references here are made solely for identification or informational purposes, without implying any affiliation, endorsement, or partnership.
We make no representations or warranties, express or implied, regarding the accuracy, completeness, or suitability of any content or products presented. Nothing on this website should be construed as legal, tax, investment, financial, medical, or other professional advice. In addition, no part of this site—including articles or product references—constitutes a solicitation, recommendation, endorsement, advertisement, or offer to buy or sell any securities, franchises, or other financial instruments, particularly in jurisdictions where such activity would be unlawful.
All content is of a general nature and may not address the specific circumstances of any individual or entity. It is not a substitute for professional advice or services. Any actions you take based on the information provided here are strictly at your own risk. You accept full responsibility for any decisions or outcomes arising from your use of this website and agree to release us from any liability in connection with your use of, or reliance upon, the content or products found herein.