|
VIRCO MFG. CORPORATION (VIRC) DCF -Bewertung |
Fully Editable: Tailor To Your Needs In Excel Or Sheets
Professional Design: Trusted, Industry-Standard Templates
Investor-Approved Valuation Models
MAC/PC Compatible, Fully Unlocked
No Expertise Is Needed; Easy To Follow
Virco Mfg. Corporation (VIRC) Bundle
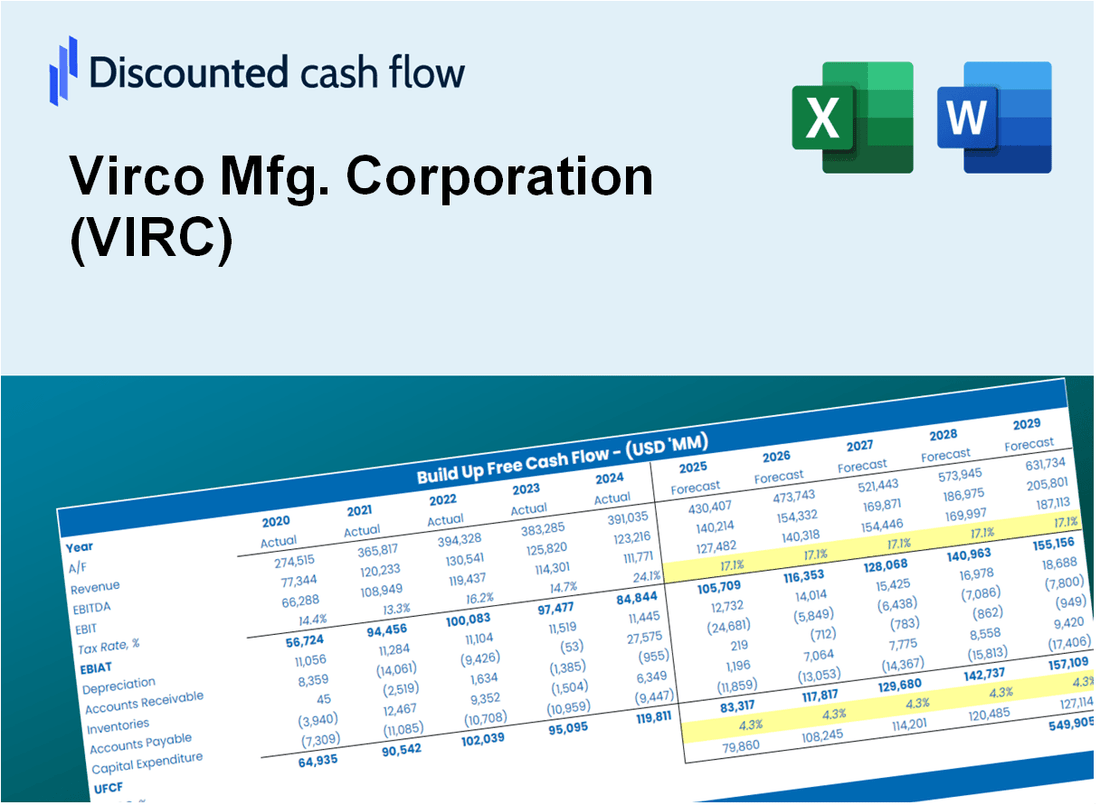
Entdecken Sie die finanzielle Zukunft von Virco Mfg. Corporation (VIRC) mit unserem benutzerfreundlichen DCF-Taschenrechner! Geben Sie Ihre Prognosen für Wachstum, Margen und Ausgaben ein, um den inneren Wert von Virco Mfg. Corporation (VIRC) zu berechnen und Ihre Anlagestrategie zu verbessern.
What You Will Get
- Real Virco Data: Preloaded financials – from revenue to EBIT – based on actual and projected figures for Virco Mfg. Corporation (VIRC).
- Full Customization: Adjust all critical parameters (yellow cells) like WACC, growth %, and tax rates to fit your analysis needs.
- Instant Valuation Updates: Automatic recalculations to assess the impact of changes on Virco’s fair value.
- Versatile Excel Template: Designed for quick edits, scenario testing, and comprehensive projections.
- Time-Saving and Accurate: Avoid building models from scratch while ensuring precision and flexibility in your assessments.
Key Features
- Comprehensive DCF Calculator: Features detailed unlevered and levered DCF valuation models tailored for Virco Mfg. Corporation (VIRC).
- WACC Calculator: Pre-structured Weighted Average Cost of Capital sheet with adjustable inputs specific to VIRC.
- Customizable Forecast Assumptions: Adjust growth rates, capital expenditures, and discount rates as needed for accurate projections.
- Integrated Financial Ratios: Evaluate profitability, leverage, and efficiency ratios relevant to Virco Mfg. Corporation (VIRC).
- Interactive Dashboard and Charts: Visual representations that summarize essential valuation metrics for straightforward analysis.
How It Works
- Step 1: Download the prebuilt Excel template with Virco Mfg. Corporation’s (VIRC) data included.
- Step 2: Explore the pre-filled sheets and familiarize yourself with the key metrics.
- Step 3: Update forecasts and assumptions in the editable yellow cells (WACC, growth, margins).
- Step 4: Instantly view recalculated results, including Virco Mfg. Corporation’s (VIRC) intrinsic value.
- Step 5: Make informed investment decisions or generate reports using the outputs.
Why Choose Virco Mfg. Corporation (VIRC)?
- Industry Leader: A proven track record in manufacturing high-quality furniture solutions.
- Innovative Designs: Cutting-edge products that meet the evolving needs of educational environments.
- Sustainable Practices: Commitment to eco-friendly materials and processes for a greener future.
- Customer-Centric Approach: Dedicated support and customization options to fit unique client requirements.
- Trusted by Institutions: Preferred choice for schools and organizations seeking reliability and excellence.
Who Should Use This Product?
- Individual Investors: Make informed decisions about buying or selling Virco Mfg. Corporation (VIRC) stock.
- Financial Analysts: Streamline valuation processes with ready-to-use financial models for Virco Mfg. Corporation (VIRC).
- Consultants: Deliver professional valuation insights on Virco Mfg. Corporation (VIRC) to clients quickly and accurately.
- Business Owners: Understand how companies like Virco Mfg. Corporation (VIRC) are valued to guide your own strategy.
- Finance Students: Learn valuation techniques using real-world data and scenarios related to Virco Mfg. Corporation (VIRC).
What the Template Contains
- Operating and Balance Sheet Data: Pre-filled Virco Mfg. Corporation (VIRC) historical data and forecasts, including revenue, EBITDA, EBIT, and capital expenditures.
- WACC Calculation: A dedicated sheet for Weighted Average Cost of Capital (WACC), including parameters like Beta, risk-free rate, and share price.
- DCF Valuation (Unlevered and Levered): Editable Discounted Cash Flow models showing intrinsic value with detailed calculations.
- Financial Statements: Pre-loaded financial statements (annual and quarterly) to support analysis.
- Key Ratios: Includes profitability, leverage, and efficiency ratios for Virco Mfg. Corporation (VIRC).
- Dashboard and Charts: Visual summary of valuation outputs and assumptions to analyze results easily.
Disclaimer
All information, articles, and product details provided on this website are for general informational and educational purposes only. We do not claim any ownership over, nor do we intend to infringe upon, any trademarks, copyrights, logos, brand names, or other intellectual property mentioned or depicted on this site. Such intellectual property remains the property of its respective owners, and any references here are made solely for identification or informational purposes, without implying any affiliation, endorsement, or partnership.
We make no representations or warranties, express or implied, regarding the accuracy, completeness, or suitability of any content or products presented. Nothing on this website should be construed as legal, tax, investment, financial, medical, or other professional advice. In addition, no part of this site—including articles or product references—constitutes a solicitation, recommendation, endorsement, advertisement, or offer to buy or sell any securities, franchises, or other financial instruments, particularly in jurisdictions where such activity would be unlawful.
All content is of a general nature and may not address the specific circumstances of any individual or entity. It is not a substitute for professional advice or services. Any actions you take based on the information provided here are strictly at your own risk. You accept full responsibility for any decisions or outcomes arising from your use of this website and agree to release us from any liability in connection with your use of, or reliance upon, the content or products found herein.