
|
Virtu Financial, Inc. (Virt) DCF -Bewertung |
Fully Editable: Tailor To Your Needs In Excel Or Sheets
Professional Design: Trusted, Industry-Standard Templates
Investor-Approved Valuation Models
MAC/PC Compatible, Fully Unlocked
No Expertise Is Needed; Easy To Follow
Virtu Financial, Inc. (VIRT) Bundle
Erforschen Sie den finanziellen Ausblick von Virtu Financial, Inc. (Virt) mit unserem benutzerfreundlichen DCF-Taschenrechner! Geben Sie Ihre Annahmen für Wachstum, Margen und Ausgaben ein, um Virtu Financial, Inc. (Virt) intrinsischer Wert zu berechnen und Ihre Anlagestrategie zu gestalten.
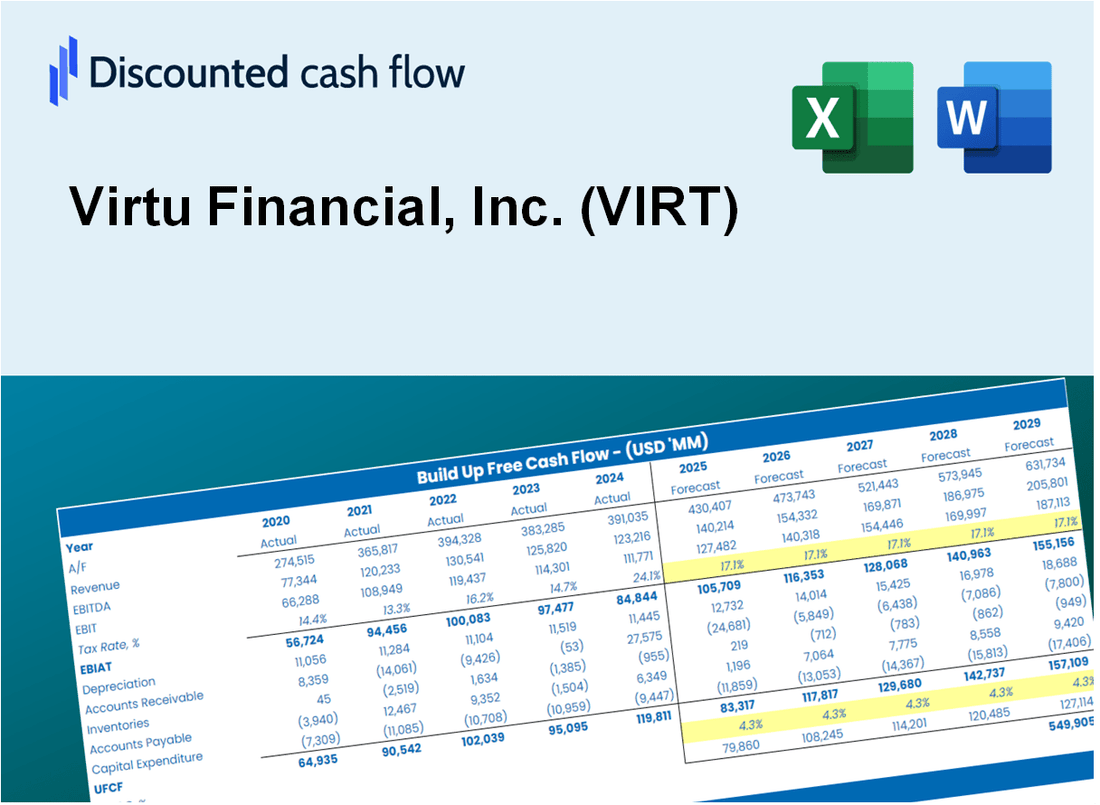
Discounted Cash Flow (DCF) - (USD MM)
| Year | AY1 2020 |
AY2 2021 |
AY3 2022 |
AY4 2023 |
AY5 2024 |
FY1 2025 |
FY2 2026 |
FY3 2027 |
FY4 2028 |
FY5 2029 |
|---|---|---|---|---|---|---|---|---|---|---|
| Revenue | 3,239.3 | 2,811.5 | 2,364.8 | 2,293.4 | 2,876.9 | 2,829.0 | 2,781.8 | 2,735.4 | 2,689.8 | 2,644.9 |
| Revenue Growth, % | 0 | -13.21 | -15.89 | -3.02 | 25.45 | -1.67 | -1.67 | -1.67 | -1.67 | -1.67 |
| EBITDA | 1,737.2 | 1,354.1 | 1,011.1 | 1,052.2 | 1,388.2 | 1,350.4 | 1,327.9 | 1,305.8 | 1,284.0 | 1,262.6 |
| EBITDA, % | 53.63 | 48.16 | 42.76 | 45.88 | 48.25 | 47.74 | 47.74 | 47.74 | 47.74 | 47.74 |
| Depreciation | 141.0 | 137.5 | 131.2 | 127.3 | 116.3 | 138.0 | 135.7 | 133.4 | 131.2 | 129.0 |
| Depreciation, % | 4.35 | 4.89 | 5.55 | 5.55 | 4.04 | 4.88 | 4.88 | 4.88 | 4.88 | 4.88 |
| EBIT | 1,596.2 | 1,216.6 | 879.9 | 924.9 | 1,271.9 | 1,212.5 | 1,192.3 | 1,172.4 | 1,152.8 | 1,133.6 |
| EBIT, % | 49.28 | 43.27 | 37.21 | 40.33 | 44.21 | 42.86 | 42.86 | 42.86 | 42.86 | 42.86 |
| Total Cash | 889.6 | 1,071.5 | 981.6 | 820.4 | 872.5 | 979.9 | 963.5 | 947.4 | 931.6 | 916.1 |
| Total Cash, percent | .0 | .0 | .0 | .0 | .0 | .0 | .0 | .0 | .0 | .0 |
| Account Receivables | 1,898.5 | 1,173.3 | 1,196.0 | 844.0 | 1,250.7 | 1,308.0 | 1,286.2 | 1,264.8 | 1,243.7 | 1,223.0 |
| Account Receivables, % | 58.61 | 41.73 | 50.58 | 36.8 | 43.47 | 46.24 | 46.24 | 46.24 | 46.24 | 46.24 |
| Inventories | .0 | .0 | .0 | .0 | .0 | .0 | .0 | .0 | .0 | .0 |
| Inventories, % | 0 | 0 | 0 | 0 | 0 | 0 | 0 | 0 | 0 | 0 |
| Accounts Payable | 1,487.1 | 1,084.5 | 769.0 | 1,642.2 | 1,522.8 | 1,366.6 | 1,343.8 | 1,321.4 | 1,299.4 | 1,277.7 |
| Accounts Payable, % | 45.91 | 38.57 | 32.52 | 71.61 | 52.93 | 48.31 | 48.31 | 48.31 | 48.31 | 48.31 |
| Capital Expenditure | -28.9 | -24.6 | -27.2 | -37.8 | -54.3 | -36.5 | -35.9 | -35.3 | -34.7 | -34.1 |
| Capital Expenditure, % | -0.89179 | -0.87363 | -1.15 | -1.65 | -1.89 | -1.29 | -1.29 | -1.29 | -1.29 | -1.29 |
| Tax Rate, % | 57.14 | 57.14 | 57.14 | 57.14 | 57.14 | 57.14 | 57.14 | 57.14 | 57.14 | 57.14 |
| EBITAT | 749.4 | 582.0 | 418.8 | 404.0 | 545.1 | 555.1 | 545.9 | 536.8 | 527.8 | 519.0 |
| Depreciation | ||||||||||
| Changes in Account Receivables | ||||||||||
| Changes in Inventories | ||||||||||
| Changes in Accounts Payable | ||||||||||
| Capital Expenditure | ||||||||||
| UFCF | 450.1 | 1,017.5 | 184.6 | 1,718.8 | 81.0 | 443.0 | 644.7 | 633.9 | 623.3 | 612.9 |
| WACC, % | 5.64 | 5.7 | 5.68 | 5.41 | 5.35 | 5.55 | 5.55 | 5.55 | 5.55 | 5.55 |
| PV UFCF | ||||||||||
| SUM PV UFCF | 2,507.2 | |||||||||
| Long Term Growth Rate, % | 2.00 | |||||||||
| Free cash flow (T + 1) | 625 | |||||||||
| Terminal Value | 17,588 | |||||||||
| Present Terminal Value | 13,422 | |||||||||
| Enterprise Value | 15,929 | |||||||||
| Net Debt | 4,840 | |||||||||
| Equity Value | 11,089 | |||||||||
| Diluted Shares Outstanding, MM | 88 | |||||||||
| Equity Value Per Share | 126.27 |
What You Will Get
- Comprehensive VIRT Financials: Access to historical and projected data for precise valuation.
- Customizable Inputs: Adjust WACC, tax rates, revenue growth, and capital expenditures to fit your analysis.
- Real-Time Calculations: Intrinsic value and NPV are computed automatically as inputs change.
- Scenario Testing: Evaluate various scenarios to assess Virtu Financial's future prospects.
- User-Friendly Interface: Designed for industry professionals while remaining approachable for newcomers.
Key Features
- Comprehensive Trading Analytics: Offers in-depth market analysis tools tailored for Virtu Financial's trading strategies.
- Risk Management Tools: Built-in features for assessing and mitigating trading risks effectively.
- Customizable Algorithmic Trading Models: Adaptable algorithms to suit various trading preferences and market conditions.
- Real-Time Market Data: Access to live market feeds for timely decision-making and execution.
- Performance Dashboards: Visual representations of trading performance metrics for quick insights.
How It Works
- Step 1: Download the prebuilt Excel template featuring Virtu Financial's (VIRT) data.
- Step 2: Navigate through the pre-filled sheets to familiarize yourself with the essential metrics.
- Step 3: Modify forecasts and assumptions in the editable yellow cells (WACC, growth, margins).
- Step 4: Instantly observe recalculated results, including Virtu Financial's (VIRT) intrinsic value.
- Step 5: Make well-informed investment decisions or create reports based on the outputs.
Why Choose This Calculator for Virtu Financial, Inc. (VIRT)?
- User-Friendly Interface: Tailored for both novices and seasoned professionals.
- Customizable Inputs: Adjust parameters easily to suit your financial analysis.
- Real-Time Feedback: Observe immediate changes to Virtu's valuation as you modify inputs.
- Pre-Loaded Data: Comes equipped with Virtu’s latest financial metrics for swift evaluations.
- Relied Upon by Experts: Utilized by traders and analysts for strategic decision-making.
Who Should Use Virtu Financial, Inc. (VIRT)?
- Traders: Enhance your trading strategies with advanced market analytics and tools.
- Institutional Investors: Benefit from high-quality execution services tailored to your needs.
- Portfolio Managers: Streamline your operations with efficient trade execution and risk management solutions.
- Market Analysts: Gain insights into market trends and liquidity using cutting-edge technology.
- Students and Researchers: Explore market dynamics and trading concepts through real-time data and case studies.
What the Template Contains
- Historical Data: Includes Virtu Financial’s past financials and baseline forecasts.
- DCF and Levered DCF Models: Detailed templates to calculate Virtu Financial’s intrinsic value.
- WACC Sheet: Pre-built calculations for Weighted Average Cost of Capital.
- Editable Inputs: Modify key drivers like growth rates, EBITDA %, and CAPEX assumptions.
- Quarterly and Annual Statements: A complete breakdown of Virtu Financial’s financials.
- Interactive Dashboard: Visualize valuation results and projections dynamically.
Disclaimer
All information, articles, and product details provided on this website are for general informational and educational purposes only. We do not claim any ownership over, nor do we intend to infringe upon, any trademarks, copyrights, logos, brand names, or other intellectual property mentioned or depicted on this site. Such intellectual property remains the property of its respective owners, and any references here are made solely for identification or informational purposes, without implying any affiliation, endorsement, or partnership.
We make no representations or warranties, express or implied, regarding the accuracy, completeness, or suitability of any content or products presented. Nothing on this website should be construed as legal, tax, investment, financial, medical, or other professional advice. In addition, no part of this site—including articles or product references—constitutes a solicitation, recommendation, endorsement, advertisement, or offer to buy or sell any securities, franchises, or other financial instruments, particularly in jurisdictions where such activity would be unlawful.
All content is of a general nature and may not address the specific circumstances of any individual or entity. It is not a substitute for professional advice or services. Any actions you take based on the information provided here are strictly at your own risk. You accept full responsibility for any decisions or outcomes arising from your use of this website and agree to release us from any liability in connection with your use of, or reliance upon, the content or products found herein.