
|
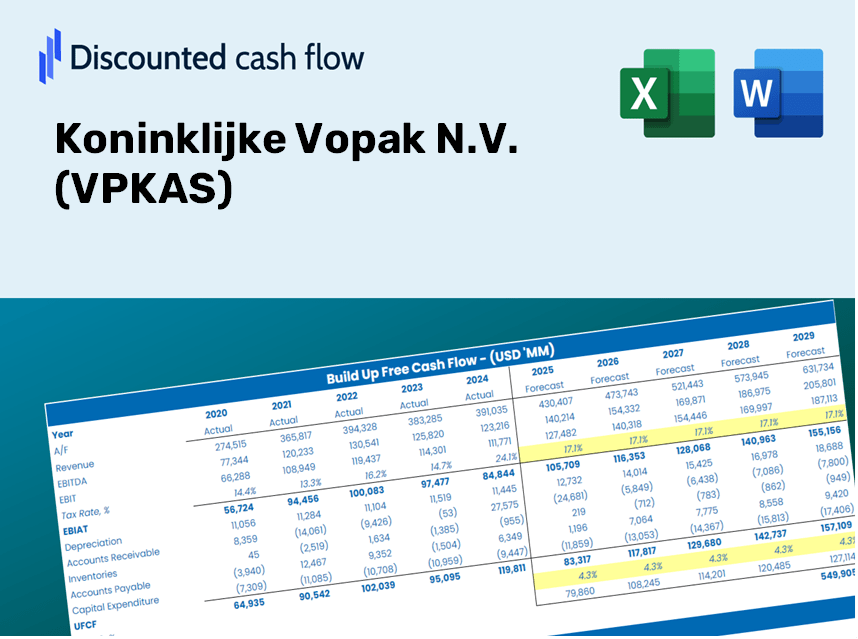
Koninklijke Vopak N. V. (VPK.as) DCF -Bewertung |
Fully Editable: Tailor To Your Needs In Excel Or Sheets
Professional Design: Trusted, Industry-Standard Templates
Investor-Approved Valuation Models
MAC/PC Compatible, Fully Unlocked
No Expertise Is Needed; Easy To Follow
Koninklijke Vopak N.V. (VPK.AS) Bundle
Verbessern Sie Ihre Anlagestrategien mit dem DCF -Taschenrechner des Koninklijke Vopak N.V. (VPKAS)! Tauchen Sie in reale Finanzdaten ein, passen Sie Wachstumsprojektionen und -kosten an und beobachten Sie sofort, wie sich diese Veränderungen auf den inneren Wert von Koninklijke Vopak N.V. (VPKAS) auswirken.
Discounted Cash Flow (DCF) - (USD MM)
| Year | AY1 2020 |
AY2 2021 |
AY3 2022 |
AY4 2023 |
AY5 2024 |
FY1 2025 |
FY2 2026 |
FY3 2027 |
FY4 2028 |
FY5 2029 |
|---|---|---|---|---|---|---|---|---|---|---|
| Revenue | 1,190.0 | 1,227.9 | 1,367.0 | 1,425.6 | 1,315.6 | 1,352.1 | 1,389.5 | 1,428.0 | 1,467.6 | 1,508.3 |
| Revenue Growth, % | 0 | 3.18 | 11.33 | 4.29 | -7.72 | 2.77 | 2.77 | 2.77 | 2.77 | 2.77 |
| EBITDA | 643.9 | 610.6 | 232.1 | 801.7 | 925.2 | 668.9 | 687.5 | 706.5 | 726.1 | 746.2 |
| EBITDA, % | 54.11 | 49.73 | 16.98 | 56.24 | 70.33 | 49.48 | 49.48 | 49.48 | 49.48 | 49.48 |
| Depreciation | 324.5 | 369.7 | 339.9 | 323.0 | 307.4 | 346.8 | 356.5 | 366.3 | 376.5 | 386.9 |
| Depreciation, % | 27.27 | 30.11 | 24.86 | 22.66 | 23.37 | 25.65 | 25.65 | 25.65 | 25.65 | 25.65 |
| EBIT | 319.4 | 240.9 | -107.8 | 478.7 | 617.8 | 322.1 | 331.0 | 340.2 | 349.6 | 359.3 |
| EBIT, % | 26.84 | 19.62 | -7.89 | 33.58 | 46.96 | 23.82 | 23.82 | 23.82 | 23.82 | 23.82 |
| Total Cash | 68.3 | 73.4 | 33.8 | 197.0 | 94.2 | 95.1 | 97.7 | 100.4 | 103.2 | 106.1 |
| Total Cash, percent | .0 | .0 | .0 | .0 | .0 | .0 | .0 | .0 | .0 | .0 |
| Account Receivables | 276.1 | 264.0 | 326.2 | 380.1 | 340.2 | 327.4 | 336.5 | 345.8 | 355.4 | 365.3 |
| Account Receivables, % | 23.2 | 21.5 | 23.86 | 26.66 | 25.86 | 24.22 | 24.22 | 24.22 | 24.22 | 24.22 |
| Inventories | .0 | .0 | .0 | .0 | .0 | .0 | .0 | .0 | .0 | .0 |
| Inventories, % | 0 | 0 | 0 | 0 | 0 | 0 | 0 | 0 | 0 | 0 |
| Accounts Payable | 51.4 | 70.1 | 77.1 | 66.2 | 124.4 | 80.5 | 82.7 | 85.0 | 87.4 | 89.8 |
| Accounts Payable, % | 4.32 | 5.71 | 5.64 | 4.64 | 9.46 | 5.95 | 5.95 | 5.95 | 5.95 | 5.95 |
| Capital Expenditure | -639.5 | -519.8 | -387.0 | -414.0 | -335.7 | -483.9 | -497.3 | -511.1 | -525.2 | -539.8 |
| Capital Expenditure, % | -53.74 | -42.33 | -28.31 | -29.04 | -25.52 | -35.79 | -35.79 | -35.79 | -35.79 | -35.79 |
| Tax Rate, % | 25.07 | 25.07 | 25.07 | 25.07 | 25.07 | 25.07 | 25.07 | 25.07 | 25.07 | 25.07 |
| EBITAT | 238.0 | 170.2 | -496.0 | 387.7 | 462.9 | 258.4 | 265.5 | 272.9 | 280.5 | 288.2 |
| Depreciation | ||||||||||
| Changes in Account Receivables | ||||||||||
| Changes in Inventories | ||||||||||
| Changes in Accounts Payable | ||||||||||
| Capital Expenditure | ||||||||||
| UFCF | -301.7 | 50.9 | -598.3 | 231.9 | 532.7 | 90.2 | 117.9 | 121.1 | 124.5 | 127.9 |
| WACC, % | 5.89 | 5.83 | 6.3 | 6 | 5.9 | 5.99 | 5.99 | 5.99 | 5.99 | 5.99 |
| PV UFCF | ||||||||||
| SUM PV UFCF | 486.2 | |||||||||
| Long Term Growth Rate, % | 2.00 | |||||||||
| Free cash flow (T + 1) | 131 | |||||||||
| Terminal Value | 3,275 | |||||||||
| Present Terminal Value | 2,449 | |||||||||
| Enterprise Value | 2,935 | |||||||||
| Net Debt | 2,672 | |||||||||
| Equity Value | 263 | |||||||||
| Diluted Shares Outstanding, MM | 121 | |||||||||
| Equity Value Per Share | 2.17 |
What You Will Receive
- Authentic VPKAS Financial Data: Pre-loaded with Koninklijke Vopak’s historical and forecasted figures for accurate analysis.
- Completely Customizable Template: Easily adjust key parameters such as revenue growth, WACC, and EBITDA percentage.
- Instant Calculations: Witness the intrinsic value of Vopak update in real-time as you make modifications.
- Professional Valuation Tool: Tailored for investors, analysts, and consultants aiming for precise DCF outcomes.
- User-Friendly Layout: Streamlined design and straightforward instructions suitable for all skill levels.
Key Features
- Real-Life VPKAS Data: Pre-loaded with Koninklijke Vopak N.V.’s historical financials and future projections.
- Fully Customizable Inputs: Tailor revenue growth, margins, WACC, tax rates, and capital expenditures to your needs.
- Dynamic Valuation Model: Automatic recalculations of Net Present Value (NPV) and intrinsic value based on your adjustments.
- Scenario Testing: Develop various forecast scenarios to explore different valuation possibilities.
- User-Friendly Design: Intuitive, organized, and suitable for both professionals and newcomers.
How It Functions
- Obtain the Template: Gain immediate access to the Excel-based VPKAS DCF Calculator.
- Enter Your Assumptions: Modify the yellow-highlighted cells to set your growth rates, WACC, margins, and other parameters.
- Automatic Calculations: The model promptly recalculates the intrinsic value of Koninklijke Vopak N.V.
- Explore Scenarios: Test various assumptions to assess potential changes in valuation.
- Review and Decide: Utilize the results to inform your investment or financial analysis decisions.
Why Choose This Calculator for Koninklijke Vopak N.V. (VPKAS)?
- Accurate Data: Utilize real financials from Vopak for dependable valuation outcomes.
- Customizable: Tailor essential parameters such as growth rates, WACC, and tax rates to fit your forecasts.
- Time-Saving: Built-in calculations remove the hassle of starting from the ground up.
- Professional-Grade Tool: Crafted for use by investors, analysts, and industry consultants.
- User-Friendly: Easy-to-navigate layout with clear step-by-step guidance for all users.
Who Can Benefit from This Product?
- Institutional Investors: Develop comprehensive and trustworthy valuation models for analyzing portfolios focused on Vopak.
- Corporate Finance Departments: Evaluate various valuation scenarios to inform strategic decisions within the company.
- Financial Consultants and Advisors: Offer clients precise valuation analyses related to Koninklijke Vopak N.V. (VPKAS).
- Students and Instructors: Leverage real-world data to enhance understanding and instruction in financial modeling.
- Industry Analysts: Gain insights into how firms like Koninklijke Vopak N.V. (VPKAS) are appraised in the market.
Contents of the Template
- Pre-Filled Data: Features Koninklijke Vopak N.V.'s historical financial records and future projections.
- Discounted Cash Flow Model: An editable DCF valuation model with automated calculations.
- Weighted Average Cost of Capital (WACC): A dedicated worksheet for computing WACC based on user-defined inputs.
- Key Financial Ratios: Evaluate Koninklijke Vopak N.V.'s profitability, operational efficiency, and financial leverage.
- Customizable Inputs: Easily modify revenue growth rates, profit margins, and tax considerations.
- User-Friendly Dashboard: Visual charts and tables that summarize essential valuation metrics.
Disclaimer
All information, articles, and product details provided on this website are for general informational and educational purposes only. We do not claim any ownership over, nor do we intend to infringe upon, any trademarks, copyrights, logos, brand names, or other intellectual property mentioned or depicted on this site. Such intellectual property remains the property of its respective owners, and any references here are made solely for identification or informational purposes, without implying any affiliation, endorsement, or partnership.
We make no representations or warranties, express or implied, regarding the accuracy, completeness, or suitability of any content or products presented. Nothing on this website should be construed as legal, tax, investment, financial, medical, or other professional advice. In addition, no part of this site—including articles or product references—constitutes a solicitation, recommendation, endorsement, advertisement, or offer to buy or sell any securities, franchises, or other financial instruments, particularly in jurisdictions where such activity would be unlawful.
All content is of a general nature and may not address the specific circumstances of any individual or entity. It is not a substitute for professional advice or services. Any actions you take based on the information provided here are strictly at your own risk. You accept full responsibility for any decisions or outcomes arising from your use of this website and agree to release us from any liability in connection with your use of, or reliance upon, the content or products found herein.