
|
Verrica Pharmaceuticals Inc. (VRCA) DCF -Bewertung |
Fully Editable: Tailor To Your Needs In Excel Or Sheets
Professional Design: Trusted, Industry-Standard Templates
Investor-Approved Valuation Models
MAC/PC Compatible, Fully Unlocked
No Expertise Is Needed; Easy To Follow
Verrica Pharmaceuticals Inc. (VRCA) Bundle
Verbessern Sie Ihre Anlagestrategien mit dem DCF -Taschenrechner des Verrica Pharmaceuticals Inc. (VRCA)! Erforschen Sie authentische Verrica -Finanzdaten, passen Sie Wachstumsprojektionen und -kosten an und beobachten Sie sofort, wie sich Modifikationen auf den inneren Wert von Verrica Pharmaceuticals Inc. (VRCA) auswirken.
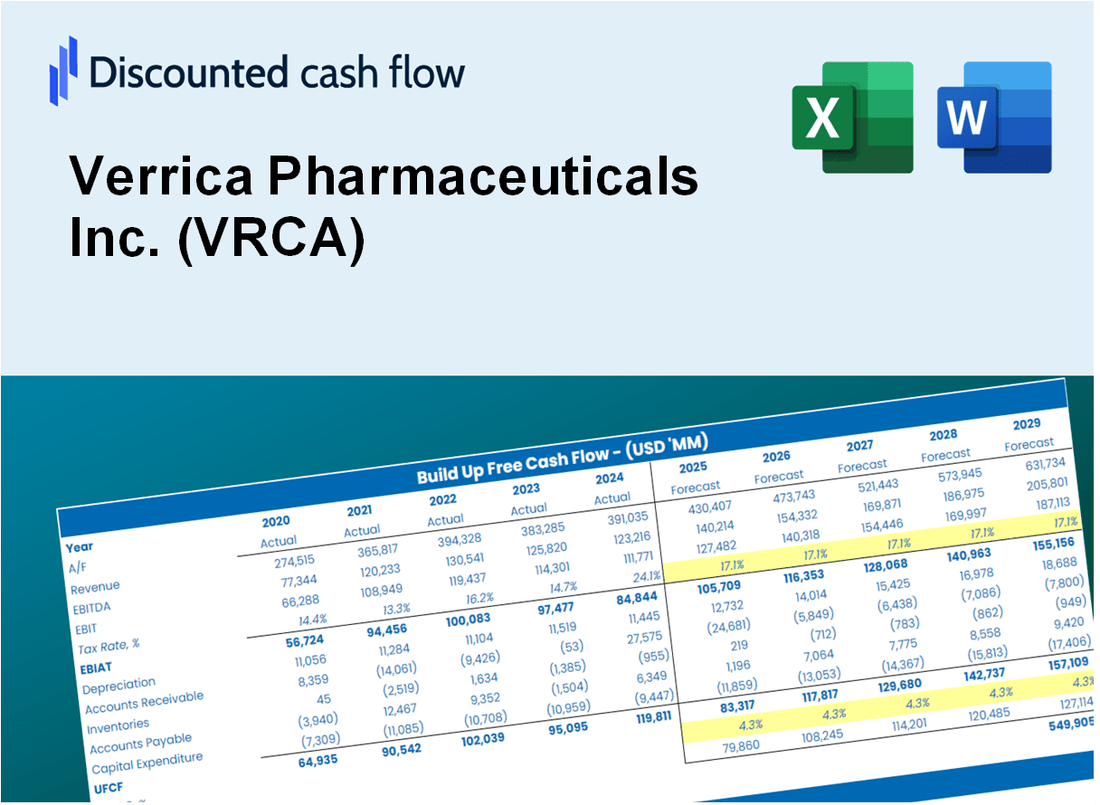
Discounted Cash Flow (DCF) - (USD MM)
| Year | AY1 2020 |
AY2 2021 |
AY3 2022 |
AY4 2023 |
AY5 2024 |
FY1 2025 |
FY2 2026 |
FY3 2027 |
FY4 2028 |
FY5 2029 |
|---|---|---|---|---|---|---|---|---|---|---|
| Revenue | .0 | 12.0 | 9.0 | 5.1 | 7.6 | 7.2 | 6.8 | 6.5 | 6.1 | 5.8 |
| Revenue Growth, % | 0 | 0 | -24.73 | -43.27 | 47.66 | -5.09 | -5.09 | -5.09 | -5.09 | -5.09 |
| EBITDA | -39.4 | -30.3 | -21.6 | -62.2 | -65.9 | -4.3 | -4.1 | -3.9 | -3.7 | -3.5 |
| EBITDA, % | 100 | -252.61 | -239.12 | -1213.84 | -870.98 | -60 | -60 | -60 | -60 | -60 |
| Depreciation | .2 | .5 | .7 | .8 | 1.3 | 2.1 | 2.0 | 1.9 | 1.8 | 1.7 |
| Depreciation, % | 100 | 3.93 | 7.95 | 16.32 | 16.77 | 28.99 | 28.99 | 28.99 | 28.99 | 28.99 |
| EBIT | -39.7 | -30.8 | -22.3 | -63.0 | -67.2 | -4.3 | -4.1 | -3.9 | -3.7 | -3.5 |
| EBIT, % | 100 | -256.54 | -247.07 | -1230.15 | -887.75 | -60 | -60 | -60 | -60 | -60 |
| Total Cash | 65.5 | 70.4 | 34.3 | 69.5 | 46.3 | 7.2 | 6.8 | 6.5 | 6.1 | 5.8 |
| Total Cash, percent | .0 | .0 | .0 | .0 | .0 | .0 | .0 | .0 | .0 | .0 |
| Account Receivables | .0 | .0 | .5 | 4.4 | .1 | 2.8 | 2.6 | 2.5 | 2.4 | 2.2 |
| Account Receivables, % | 100 | 0 | 5.39 | 86.18 | 1.02 | 38.52 | 38.52 | 38.52 | 38.52 | 38.52 |
| Inventories | .0 | .0 | .0 | 1.0 | 2.5 | 2.2 | 2.1 | 2.0 | 1.9 | 1.8 |
| Inventories, % | 100 | 0 | 0 | 19.95 | 32.55 | 30.5 | 30.5 | 30.5 | 30.5 | 30.5 |
| Accounts Payable | .3 | .8 | .5 | 2.5 | 1.9 | 2.7 | 2.5 | 2.4 | 2.3 | 2.2 |
| Accounts Payable, % | 100 | 7.04 | 5.61 | 48.09 | 25.06 | 37.16 | 37.16 | 37.16 | 37.16 | 37.16 |
| Capital Expenditure | -1.5 | -.9 | -.3 | -.4 | .0 | -.3 | -.2 | -.2 | -.2 | -.2 |
| Capital Expenditure, % | 100 | -7.36 | -3.34 | -7.06 | -0.35686 | -3.62 | -3.62 | -3.62 | -3.62 | -3.62 |
| Tax Rate, % | 0 | 0 | 0 | 0 | 0 | 0 | 0 | 0 | 0 | 0 |
| EBITAT | -42.3 | -30.8 | -22.3 | -63.0 | -67.2 | -4.3 | -4.1 | -3.9 | -3.7 | -3.5 |
| Depreciation | ||||||||||
| Changes in Account Receivables | ||||||||||
| Changes in Inventories | ||||||||||
| Changes in Accounts Payable | ||||||||||
| Capital Expenditure | ||||||||||
| UFCF | -43.2 | -30.7 | -22.7 | -65.6 | -63.6 | -4.1 | -2.2 | -2.1 | -2.0 | -1.9 |
| WACC, % | 17.72 | 17.72 | 17.72 | 17.72 | 17.72 | 17.72 | 17.72 | 17.72 | 17.72 | 17.72 |
| PV UFCF | ||||||||||
| SUM PV UFCF | -8.3 | |||||||||
| Long Term Growth Rate, % | 2.00 | |||||||||
| Free cash flow (T + 1) | -2 | |||||||||
| Terminal Value | -12 | |||||||||
| Present Terminal Value | -6 | |||||||||
| Enterprise Value | -14 | |||||||||
| Net Debt | 0 | |||||||||
| Equity Value | -13 | |||||||||
| Diluted Shares Outstanding, MM | 5 | |||||||||
| Equity Value Per Share | -2.60 |
What You Will Get
- Comprehensive VRCA Financials: Access to historical and projected data for precise valuation.
- Customizable Variables: Adjust WACC, tax rates, revenue growth, and capital expenditures as needed.
- Real-Time Calculations: Intrinsic value and NPV are calculated automatically and updated dynamically.
- Scenario Analysis: Evaluate various scenarios to assess Verrica's future performance.
- User-Friendly Interface: Designed for industry experts while remaining approachable for newcomers.
Key Features
- Comprehensive Data: Verrica Pharmaceuticals Inc.'s historical financials and anticipated forecasts.
- Customizable Parameters: Adjust inputs such as WACC, tax rates, revenue growth, and EBITDA margins.
- Real-Time Insights: View the intrinsic value of Verrica Pharmaceuticals Inc. recalculated instantly.
- Intuitive Visualizations: Dashboard charts present valuation outcomes and essential metrics.
- Designed for Precision: A professional-grade tool tailored for analysts, investors, and finance professionals.
How It Works
- Download the Template: Gain immediate access to the Excel-based VRCA DCF Calculator.
- Input Your Assumptions: Modify the yellow-highlighted cells for growth rates, WACC, margins, and additional parameters.
- Instant Calculations: The model automatically recalculates Verrica Pharmaceuticals' intrinsic value.
- Test Scenarios: Experiment with various assumptions to assess potential changes in valuation.
- Analyze and Decide: Utilize the outcomes to inform your investment or financial strategy.
Why Choose This Calculator for Verrica Pharmaceuticals Inc. (VRCA)?
- Accuracy: Utilizes real Verrica financial data to ensure precise calculations.
- Flexibility: Allows users to easily test and adjust inputs according to their needs.
- Time-Saving: Avoid the complexities of creating a financial model from the ground up.
- Professional-Grade: Crafted with the expertise and precision expected at the CFO level.
- User-Friendly: Designed for simplicity, making it accessible for users with varying levels of financial knowledge.
Who Should Use This Product?
- Investors: Accurately assess Verrica Pharmaceuticals Inc.'s (VRCA) fair value prior to making investment choices.
- CFOs: Utilize a professional-grade DCF model for comprehensive financial reporting and analysis.
- Consultants: Easily customize the template for client valuation reports related to Verrica Pharmaceuticals Inc. (VRCA).
- Entrepreneurs: Acquire knowledge on financial modeling practices employed by leading pharmaceutical companies.
- Educators: Implement it as a teaching resource to illustrate valuation techniques in the pharmaceutical sector.
What the Template Contains
- Pre-Filled DCF Model: Verrica Pharmaceuticals Inc. (VRCA)’s financial data preloaded for immediate use.
- WACC Calculator: Detailed calculations for Weighted Average Cost of Capital.
- Financial Ratios: Evaluate Verrica Pharmaceuticals Inc. (VRCA)’s profitability, leverage, and efficiency.
- Editable Inputs: Change assumptions such as growth, margins, and CAPEX to fit your scenarios.
- Financial Statements: Annual and quarterly reports to support detailed analysis.
- Interactive Dashboard: Easily visualize key valuation metrics and results.
Disclaimer
All information, articles, and product details provided on this website are for general informational and educational purposes only. We do not claim any ownership over, nor do we intend to infringe upon, any trademarks, copyrights, logos, brand names, or other intellectual property mentioned or depicted on this site. Such intellectual property remains the property of its respective owners, and any references here are made solely for identification or informational purposes, without implying any affiliation, endorsement, or partnership.
We make no representations or warranties, express or implied, regarding the accuracy, completeness, or suitability of any content or products presented. Nothing on this website should be construed as legal, tax, investment, financial, medical, or other professional advice. In addition, no part of this site—including articles or product references—constitutes a solicitation, recommendation, endorsement, advertisement, or offer to buy or sell any securities, franchises, or other financial instruments, particularly in jurisdictions where such activity would be unlawful.
All content is of a general nature and may not address the specific circumstances of any individual or entity. It is not a substitute for professional advice or services. Any actions you take based on the information provided here are strictly at your own risk. You accept full responsibility for any decisions or outcomes arising from your use of this website and agree to release us from any liability in connection with your use of, or reliance upon, the content or products found herein.