
|
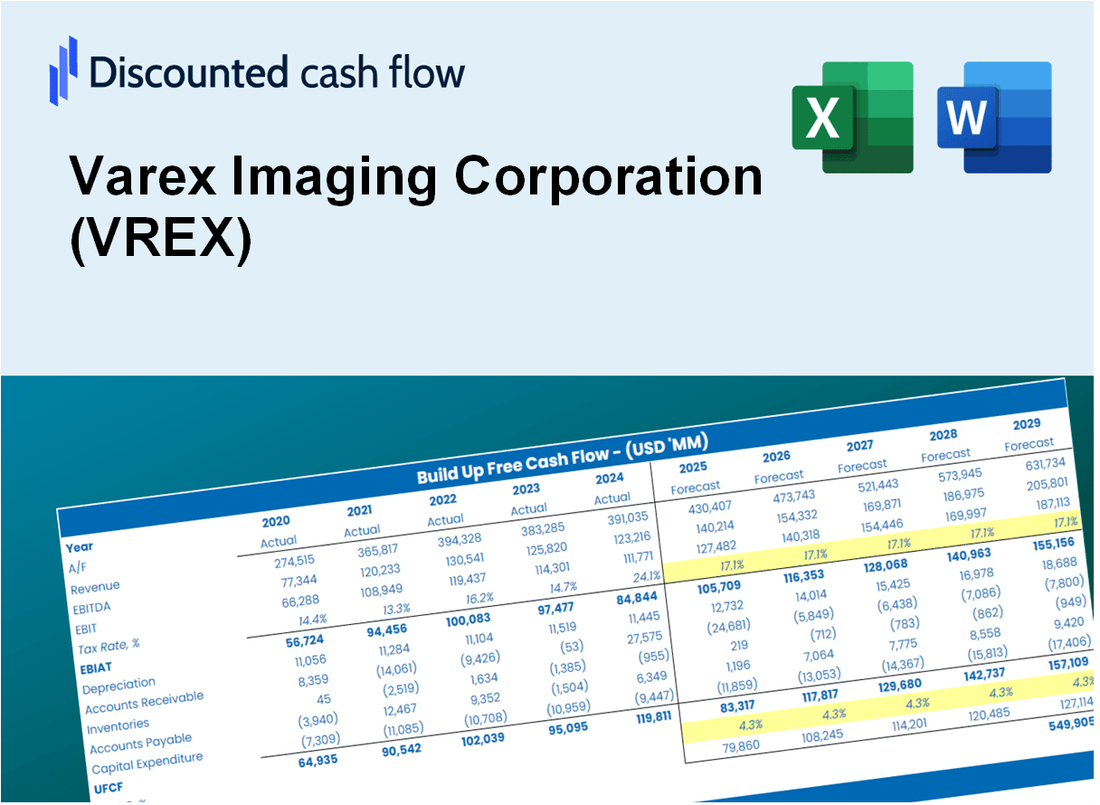
Varex Imaging Corporation (VREX) DCF -Bewertung |
Fully Editable: Tailor To Your Needs In Excel Or Sheets
Professional Design: Trusted, Industry-Standard Templates
Investor-Approved Valuation Models
MAC/PC Compatible, Fully Unlocked
No Expertise Is Needed; Easy To Follow
Varex Imaging Corporation (VREX) Bundle
In unserem DCF-Taschenrechner für die Genauigkeit, die für die Genauigkeit entwickelt wurde, können Sie die Bewertung der Varex Imaging Corporation anhand aktueller Finanzdaten bewerten und vollständige Flexibilität bieten, um alle wesentlichen Parameter für verbesserte Projektionen zu ändern.
What You Will Get
- Editable Forecast Inputs: Easily modify key assumptions (growth %, margins, WACC) to explore various scenarios.
- Real-World Data: Varex Imaging Corporation’s (VREX) financial data pre-loaded to facilitate your analysis.
- Automatic DCF Outputs: The template computes Net Present Value (NPV) and intrinsic value automatically for you.
- Customizable and Professional: A refined Excel model that adjusts to your valuation requirements.
- Built for Analysts and Investors: Perfect for evaluating projections, confirming strategies, and enhancing efficiency.
Key Features
- Customizable Financial Inputs: Adjust essential parameters such as revenue projections, operating margins, and capital investments.
- Instant DCF Valuation: Provides immediate calculations of intrinsic value, NPV, and other financial metrics.
- High-Precision Accuracy: Leverages Varex Imaging’s actual financial data for credible valuation results.
- Effortless Scenario Analysis: Easily explore various assumptions and assess different outcomes.
- Efficiency Booster: Streamline the valuation process without the hassle of creating intricate models from the ground up.
How It Works
- Step 1: Download the prebuilt Excel template featuring Varex Imaging Corporation’s (VREX) data.
- Step 2: Review the pre-filled sheets to familiarize yourself with the essential metrics.
- Step 3: Modify forecasts and assumptions in the editable yellow cells (WACC, growth, margins).
- Step 4: Instantly see the recalculated results, including Varex Imaging Corporation’s (VREX) intrinsic value.
- Step 5: Make well-informed investment decisions or create reports based on the outputs.
Why Choose This Calculator for Varex Imaging Corporation (VREX)?
- Precise Financials: Up-to-date Varex Imaging financial data guarantees trustworthy valuation outcomes.
- Fully Customizable: Tailor essential inputs such as growth rates, WACC, and tax rates to align with your forecasts.
- Efficient: Built-in calculations save you time by eliminating the need to start from the ground up.
- Expert-Level Tool: Crafted for investors, analysts, and financial consultants.
- Easy to Use: User-friendly design and clear instructions make it accessible for everyone.
Who Should Use This Product?
- Investors: Evaluate Varex Imaging Corporation’s (VREX) valuation before making investment decisions.
- CFOs and Financial Analysts: Enhance valuation methodologies and assess financial forecasts.
- Startup Founders: Understand the valuation processes of established companies like Varex Imaging.
- Consultants: Provide comprehensive valuation reports for their clientele.
- Students and Educators: Utilize current data to practice and teach valuation strategies.
What the Template Contains
- Operating and Balance Sheet Data: Pre-filled Varex Imaging Corporation (VREX) historical data and forecasts, including revenue, EBITDA, EBIT, and capital expenditures.
- WACC Calculation: A dedicated sheet for Weighted Average Cost of Capital (WACC), including parameters like Beta, risk-free rate, and share price.
- DCF Valuation (Unlevered and Levered): Editable Discounted Cash Flow models showing intrinsic value with detailed calculations.
- Financial Statements: Pre-loaded financial statements (annual and quarterly) to support analysis.
- Key Ratios: Includes profitability, leverage, and efficiency ratios for Varex Imaging Corporation (VREX).
- Dashboard and Charts: Visual summary of valuation outputs and assumptions to analyze results easily.
Disclaimer
All information, articles, and product details provided on this website are for general informational and educational purposes only. We do not claim any ownership over, nor do we intend to infringe upon, any trademarks, copyrights, logos, brand names, or other intellectual property mentioned or depicted on this site. Such intellectual property remains the property of its respective owners, and any references here are made solely for identification or informational purposes, without implying any affiliation, endorsement, or partnership.
We make no representations or warranties, express or implied, regarding the accuracy, completeness, or suitability of any content or products presented. Nothing on this website should be construed as legal, tax, investment, financial, medical, or other professional advice. In addition, no part of this site—including articles or product references—constitutes a solicitation, recommendation, endorsement, advertisement, or offer to buy or sell any securities, franchises, or other financial instruments, particularly in jurisdictions where such activity would be unlawful.
All content is of a general nature and may not address the specific circumstances of any individual or entity. It is not a substitute for professional advice or services. Any actions you take based on the information provided here are strictly at your own risk. You accept full responsibility for any decisions or outcomes arising from your use of this website and agree to release us from any liability in connection with your use of, or reliance upon, the content or products found herein.