
|
Varonis Systems, Inc. (VRNS) DCF -Bewertung |
Fully Editable: Tailor To Your Needs In Excel Or Sheets
Professional Design: Trusted, Industry-Standard Templates
Investor-Approved Valuation Models
MAC/PC Compatible, Fully Unlocked
No Expertise Is Needed; Easy To Follow
Varonis Systems, Inc. (VRNS) Bundle
Optimieren Sie Ihre Zeit und verbessern Sie die Präzision mit unserem DCF -Taschenrechner von Varonis Systems, Inc. (VRNS)! Mithilfe der tatsächlichen Daten aus Varonis und anpassbaren Annahmen ermöglichen dieses Tool Sie, Varonis wie ein erfahrener Investor zu prognostizieren, zu analysieren und zu bewerten.
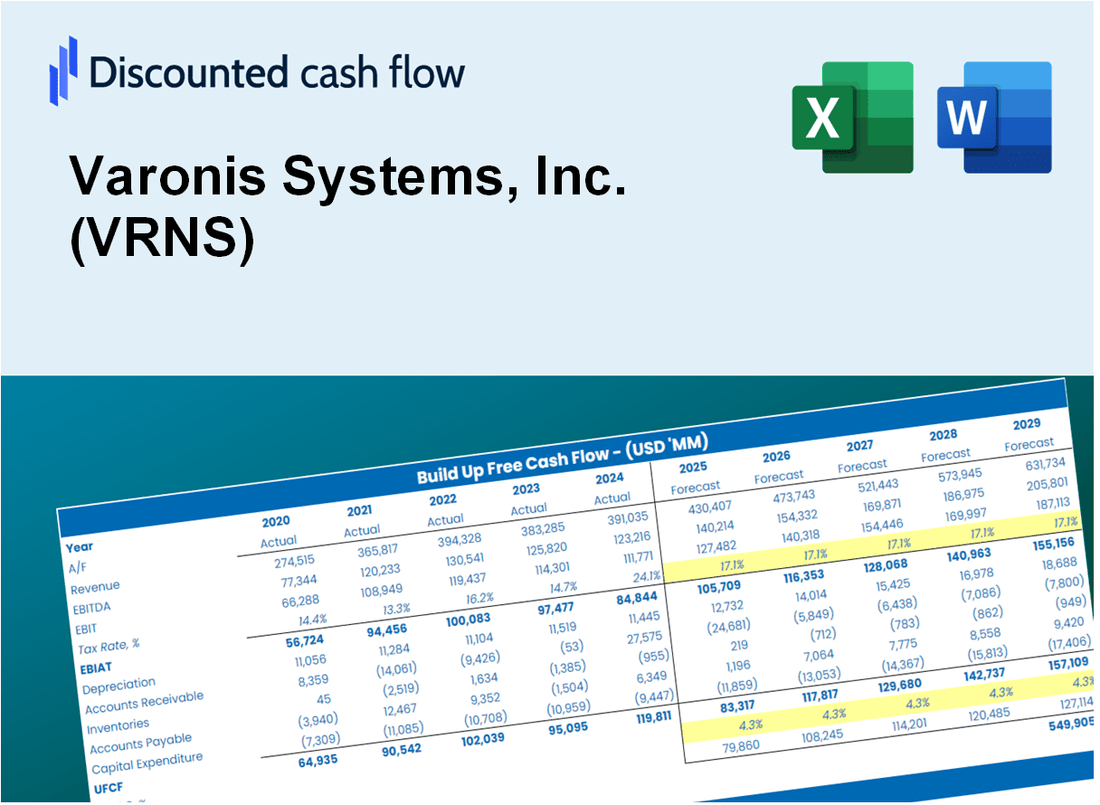
Discounted Cash Flow (DCF) - (USD MM)
| Year | AY1 2020 |
AY2 2021 |
AY3 2022 |
AY4 2023 |
AY5 2024 |
FY1 2025 |
FY2 2026 |
FY3 2027 |
FY4 2028 |
FY5 2029 |
|---|---|---|---|---|---|---|---|---|---|---|
| Revenue | 292.7 | 390.1 | 473.6 | 499.2 | 551.0 | 648.0 | 762.1 | 896.4 | 1,054.3 | 1,240.0 |
| Revenue Growth, % | 0 | 33.29 | 21.4 | 5.39 | 10.38 | 17.62 | 17.62 | 17.62 | 17.62 | 17.62 |
| EBITDA | -68.5 | -98.7 | -82.0 | -70.6 | -63.6 | -118.8 | -139.8 | -164.4 | -193.4 | -227.4 |
| EBITDA, % | -23.41 | -25.3 | -17.32 | -14.13 | -11.54 | -18.34 | -18.34 | -18.34 | -18.34 | -18.34 |
| Depreciation | 18.9 | 19.1 | 21.5 | 11.7 | 11.1 | 26.3 | 30.9 | 36.3 | 42.7 | 50.2 |
| Depreciation, % | 6.46 | 4.9 | 4.54 | 2.34 | 2.02 | 4.05 | 4.05 | 4.05 | 4.05 | 4.05 |
| EBIT | -87.4 | -117.8 | -103.5 | -82.3 | -74.7 | -145.1 | -170.7 | -200.7 | -236.1 | -277.7 |
| EBIT, % | -29.87 | -30.2 | -21.86 | -16.48 | -13.56 | -22.39 | -22.39 | -22.39 | -22.39 | -22.39 |
| Total Cash | 298.3 | 807.6 | 732.5 | 533.7 | 568.4 | 648.0 | 762.1 | 896.4 | 1,054.3 | 1,240.0 |
| Total Cash, percent | .0 | .0 | .0 | .0 | .0 | .0 | .0 | .0 | .0 | .0 |
| Account Receivables | 95.8 | 120.5 | 143.2 | 184.5 | 236.6 | 225.2 | 264.9 | 311.5 | 366.4 | 430.9 |
| Account Receivables, % | 32.74 | 30.89 | 30.22 | 36.97 | 42.95 | 34.75 | 34.75 | 34.75 | 34.75 | 34.75 |
| Inventories | .0 | .0 | .0 | .0 | .0 | .0 | .0 | .0 | .0 | .0 |
| Inventories, % | 0 | 0 | 0 | 0 | 0 | 0 | 0 | 0 | 0 | 0 |
| Accounts Payable | .9 | 5.3 | 3.0 | .7 | 4.3 | 4.1 | 4.9 | 5.7 | 6.7 | 7.9 |
| Accounts Payable, % | 0.29041 | 1.36 | 0.62538 | 0.13463 | 0.78283 | 0.63958 | 0.63958 | 0.63958 | 0.63958 | 0.63958 |
| Capital Expenditure | -10.1 | -10.5 | -11.4 | -5.1 | -6.7 | -14.0 | -16.4 | -19.3 | -22.7 | -26.8 |
| Capital Expenditure, % | -3.46 | -2.69 | -2.41 | -1.02 | -1.21 | -2.16 | -2.16 | -2.16 | -2.16 | -2.16 |
| Tax Rate, % | -15.37 | -15.37 | -15.37 | -15.37 | -15.37 | -15.37 | -15.37 | -15.37 | -15.37 | -15.37 |
| EBITAT | -95.7 | -124.2 | -116.3 | -95.5 | -86.2 | -145.1 | -170.7 | -200.7 | -236.1 | -277.7 |
| Depreciation | ||||||||||
| Changes in Account Receivables | ||||||||||
| Changes in Inventories | ||||||||||
| Changes in Accounts Payable | ||||||||||
| Capital Expenditure | ||||||||||
| UFCF | -181.8 | -135.8 | -131.2 | -132.6 | -130.2 | -121.6 | -195.2 | -229.5 | -270.0 | -317.5 |
| WACC, % | 6.26 | 6.26 | 6.26 | 6.26 | 6.26 | 6.26 | 6.26 | 6.26 | 6.26 | 6.26 |
| PV UFCF | ||||||||||
| SUM PV UFCF | -924.8 | |||||||||
| Long Term Growth Rate, % | 2.00 | |||||||||
| Free cash flow (T + 1) | -324 | |||||||||
| Terminal Value | -7,609 | |||||||||
| Present Terminal Value | -5,618 | |||||||||
| Enterprise Value | -6,542 | |||||||||
| Net Debt | 569 | |||||||||
| Equity Value | -7,111 | |||||||||
| Diluted Shares Outstanding, MM | 112 | |||||||||
| Equity Value Per Share | -63.69 |
What You Will Get
- Real VRNS Financial Data: Pre-filled with Varonis Systems’ historical and projected data for precise analysis.
- Fully Editable Template: Modify key inputs like revenue growth, WACC, and EBITDA % with ease.
- Automatic Calculations: See Varonis Systems’ intrinsic value update instantly based on your changes.
- Professional Valuation Tool: Designed for investors, analysts, and consultants seeking accurate DCF results.
- User-Friendly Design: Simple structure and clear instructions for all experience levels.
Key Features
- Comprehensive Data Insights: Gain access to precise historical data and forecasts specific to Varonis Systems, Inc. (VRNS).
- Tailored Assumptions: Modify highlighted cells to adjust key metrics such as WACC, growth rates, and profit margins.
- Real-Time Calculations: Automatic recalculations for DCF, Net Present Value (NPV), and cash flow assessments.
- User-Friendly Dashboard: Intuitive charts and visuals to easily interpret your valuation outcomes.
- Designed for All Skill Levels: An accessible format suitable for investors, CFOs, and consultants alike.
How It Works
- Download: Obtain the pre-configured Excel file featuring Varonis Systems, Inc.'s (VRNS) financial data.
- Customize: Modify projections, such as revenue growth, EBITDA %, and WACC.
- Update Automatically: The intrinsic value and NPV calculations refresh in real-time.
- Test Scenarios: Develop various forecasts and instantly compare results.
- Make Decisions: Leverage the valuation findings to inform your investment strategy.
Why Choose This Calculator for Varonis Systems, Inc. (VRNS)?
- Reliable Metrics: Utilize authentic Varonis financial data for trustworthy valuation outcomes.
- Tailorable: Modify essential variables such as growth rates, WACC, and tax rates to align with your forecasts.
- Efficiency Boost: Ready-made calculations save you from starting from the ground up.
- Professional-Quality Tool: Crafted for investors, analysts, and consultants in the field.
- Easy to Use: User-friendly design and clear instructions cater to all experience levels.
Who Should Use Varonis Systems, Inc. (VRNS)?
- Cybersecurity Students: Understand data protection strategies and apply them to real-world scenarios.
- Researchers: Utilize advanced analytics and models in your studies related to data security.
- IT Professionals: Evaluate your data management practices and explore outcomes with Varonis solutions.
- Data Analysts: Enhance your analysis with a comprehensive, customizable data security framework.
- Business Leaders: Learn how leading companies like Varonis protect their critical data and ensure compliance.
What the Template Contains
- Preloaded VRNS Data: Historical and projected financial data, including revenue, EBIT, and capital expenditures.
- DCF and WACC Models: Professional-grade sheets for calculating intrinsic value and Weighted Average Cost of Capital.
- Editable Inputs: Yellow-highlighted cells for adjusting revenue growth, tax rates, and discount rates.
- Financial Statements: Comprehensive annual and quarterly financials for deeper analysis.
- Key Ratios: Profitability, leverage, and efficiency ratios to evaluate performance.
- Dashboard and Charts: Visual summaries of valuation outcomes and assumptions.
Disclaimer
All information, articles, and product details provided on this website are for general informational and educational purposes only. We do not claim any ownership over, nor do we intend to infringe upon, any trademarks, copyrights, logos, brand names, or other intellectual property mentioned or depicted on this site. Such intellectual property remains the property of its respective owners, and any references here are made solely for identification or informational purposes, without implying any affiliation, endorsement, or partnership.
We make no representations or warranties, express or implied, regarding the accuracy, completeness, or suitability of any content or products presented. Nothing on this website should be construed as legal, tax, investment, financial, medical, or other professional advice. In addition, no part of this site—including articles or product references—constitutes a solicitation, recommendation, endorsement, advertisement, or offer to buy or sell any securities, franchises, or other financial instruments, particularly in jurisdictions where such activity would be unlawful.
All content is of a general nature and may not address the specific circumstances of any individual or entity. It is not a substitute for professional advice or services. Any actions you take based on the information provided here are strictly at your own risk. You accept full responsibility for any decisions or outcomes arising from your use of this website and agree to release us from any liability in connection with your use of, or reliance upon, the content or products found herein.