
|
Verisign, Inc. (VRSN) DCF -Bewertung |
Fully Editable: Tailor To Your Needs In Excel Or Sheets
Professional Design: Trusted, Industry-Standard Templates
Investor-Approved Valuation Models
MAC/PC Compatible, Fully Unlocked
No Expertise Is Needed; Easy To Follow
VeriSign, Inc. (VRSN) Bundle
Sparen Sie Zeit und verbessern Sie die Genauigkeit mit unserem (VRSN) DCF -Taschenrechner! Mit dem Zugriff auf reale Daten und anpassbare Annahmen können Sie mit diesem Tool wie ein erfahrener Anleger prognostizieren, analysieren und Value Verisign, Inc. haben.
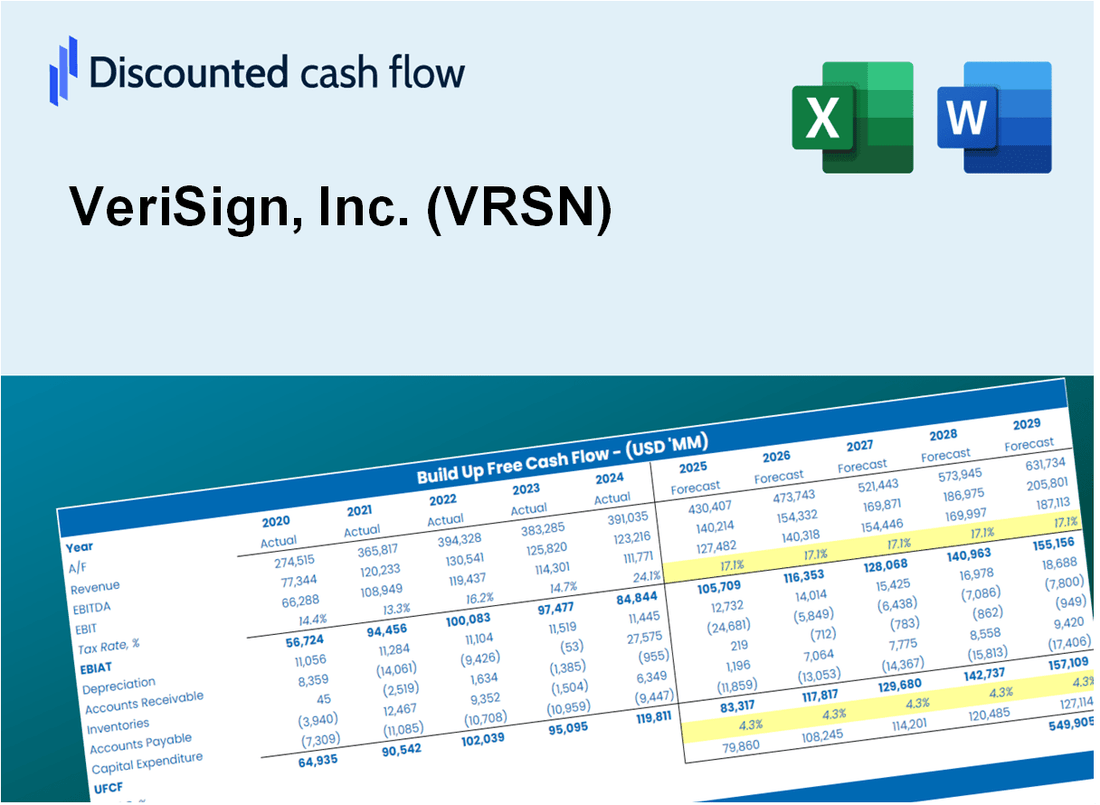
Discounted Cash Flow (DCF) - (USD MM)
| Year | AY1 2020 |
AY2 2021 |
AY3 2022 |
AY4 2023 |
AY5 2024 |
FY1 2025 |
FY2 2026 |
FY3 2027 |
FY4 2028 |
FY5 2029 |
|---|---|---|---|---|---|---|---|---|---|---|
| Revenue | 1,265.1 | 1,327.6 | 1,424.9 | 1,493.1 | 1,557.4 | 1,640.6 | 1,728.2 | 1,820.5 | 1,917.8 | 2,020.2 |
| Revenue Growth, % | 0 | 4.94 | 7.33 | 4.79 | 4.31 | 5.34 | 5.34 | 5.34 | 5.34 | 5.34 |
| EBITDA | 886.7 | 913.4 | 1,002.4 | 1,095.9 | 1,134.1 | 1,166.3 | 1,228.6 | 1,294.3 | 1,363.4 | 1,436.2 |
| EBITDA, % | 70.1 | 68.8 | 70.35 | 73.4 | 72.82 | 71.09 | 71.09 | 71.09 | 71.09 | 71.09 |
| Depreciation | 46.4 | 47.9 | 46.9 | 44.1 | 36.9 | 52.1 | 54.9 | 57.9 | 60.9 | 64.2 |
| Depreciation, % | 3.66 | 3.61 | 3.29 | 2.95 | 2.37 | 3.18 | 3.18 | 3.18 | 3.18 | 3.18 |
| EBIT | 840.4 | 865.5 | 955.5 | 1,051.8 | 1,097.2 | 1,114.2 | 1,173.7 | 1,236.4 | 1,302.5 | 1,372.0 |
| EBIT, % | 66.43 | 65.19 | 67.06 | 70.44 | 70.45 | 67.92 | 67.92 | 67.92 | 67.92 | 67.92 |
| Total Cash | 1,166.9 | 1,205.8 | 980.4 | 926.4 | 599.9 | 1,156.4 | 1,218.2 | 1,283.3 | 1,351.8 | 1,424.0 |
| Total Cash, percent | .0 | .0 | .0 | .0 | .0 | .0 | .0 | .0 | .0 | .0 |
| Account Receivables | 8.2 | 13.0 | 8.1 | 13.6 | 7.8 | 11.8 | 12.5 | 13.1 | 13.8 | 14.6 |
| Account Receivables, % | 0.6493 | 0.97569 | 0.56846 | 0.91086 | 0.50083 | 0.72103 | 0.72103 | 0.72103 | 0.72103 | 0.72103 |
| Inventories | .0 | .0 | .0 | .0 | .0 | .0 | .0 | .0 | .0 | .0 |
| Inventories, % | 0 | 0 | 0 | 0 | 0 | 0 | 0 | 0 | 0 | 0 |
| Accounts Payable | 12.3 | 9.0 | 9.8 | 12.5 | 10.6 | 12.7 | 13.3 | 14.1 | 14.8 | 15.6 |
| Accounts Payable, % | 0.97545 | 0.67793 | 0.68777 | 0.83718 | 0.68062 | 0.77179 | 0.77179 | 0.77179 | 0.77179 | 0.77179 |
| Capital Expenditure | -43.4 | -53.0 | -27.4 | -45.8 | -28.1 | -46.7 | -49.1 | -51.8 | -54.5 | -57.5 |
| Capital Expenditure, % | -3.43 | -3.99 | -1.92 | -3.07 | -1.8 | -2.84 | -2.84 | -2.84 | -2.84 | -2.84 |
| Tax Rate, % | 23.11 | 23.11 | 23.11 | 23.11 | 23.11 | 23.11 | 23.11 | 23.11 | 23.11 | 23.11 |
| EBITAT | 912.8 | 868.3 | 731.4 | 880.6 | 843.6 | 974.2 | 1,026.2 | 1,081.0 | 1,138.8 | 1,199.6 |
| Depreciation | ||||||||||
| Changes in Account Receivables | ||||||||||
| Changes in Inventories | ||||||||||
| Changes in Accounts Payable | ||||||||||
| Capital Expenditure | ||||||||||
| UFCF | 919.9 | 855.2 | 756.6 | 876.1 | 856.3 | 977.7 | 1,032.0 | 1,087.2 | 1,145.2 | 1,206.4 |
| WACC, % | 7.22 | 7.22 | 7.15 | 7.17 | 7.15 | 7.18 | 7.18 | 7.18 | 7.18 | 7.18 |
| PV UFCF | ||||||||||
| SUM PV UFCF | 4,414.4 | |||||||||
| Long Term Growth Rate, % | 3.00 | |||||||||
| Free cash flow (T + 1) | 1,243 | |||||||||
| Terminal Value | 29,727 | |||||||||
| Present Terminal Value | 21,018 | |||||||||
| Enterprise Value | 25,432 | |||||||||
| Net Debt | 1,595 | |||||||||
| Equity Value | 23,837 | |||||||||
| Diluted Shares Outstanding, MM | 98 | |||||||||
| Equity Value Per Share | 242.74 |
What You Will Get
- Editable Forecast Inputs: Easily modify assumptions (growth %, margins, WACC) to explore various scenarios.
- Real-World Data: VeriSign, Inc. (VRSN) financial data pre-filled to kickstart your analysis.
- Automatic DCF Outputs: The template computes Net Present Value (NPV) and intrinsic value for you.
- Customizable and Professional: A refined Excel model that adjusts to your valuation requirements.
- Built for Analysts and Investors: Perfect for evaluating projections, confirming strategies, and optimizing time.
Key Features
- Real-Time VRSN Data: Pre-filled with VeriSign’s historical performance metrics and future projections.
- Comprehensive Customization Options: Modify key parameters such as revenue growth, profit margins, discount rates, tax obligations, and capital investments.
- Adaptive Valuation Framework: Instant updates to Net Present Value (NPV) and intrinsic value based on your customized inputs.
- Scenario Analysis: Develop various forecasting scenarios to evaluate different valuation results.
- Intuitive Interface: Clean, organized design suitable for both seasoned professionals and newcomers.
How It Works
- Step 1: Download the Excel file.
- Step 2: Review VeriSign's pre-filled financial data and forecasts.
- Step 3: Modify key inputs such as revenue growth, WACC, and tax rates (highlighted cells).
- Step 4: Observe the DCF model update in real-time as you adjust your assumptions.
- Step 5: Evaluate the outputs and leverage the results for your investment choices.
Why Choose This Calculator?
- User-Friendly Interface: Perfectly crafted for both novices and seasoned professionals.
- Customizable Inputs: Effortlessly adjust parameters to suit your financial analysis.
- Real-Time Feedback: Witness immediate updates to VeriSign’s valuation as you change inputs.
- Preloaded Data: Comes equipped with VeriSign’s actual financial information for swift evaluations.
- Preferred by Experts: A go-to tool for investors and analysts to enhance decision-making.
Who Should Use VeriSign, Inc. (VRSN)?
- Investors: Make informed decisions with a reliable platform for domain and security services.
- Web Developers: Streamline your projects with VeriSign's robust DNS and SSL solutions.
- Business Owners: Protect your online presence with trusted domain registration and security options.
- IT Professionals: Enhance your cybersecurity strategies using VeriSign's advanced services.
- Students and Educators: Explore real-world applications of internet security and domain management in your studies.
What the Template Contains
- Operating and Balance Sheet Data: Pre-filled VeriSign historical data and forecasts, including revenue, EBITDA, EBIT, and capital expenditures.
- WACC Calculation: A dedicated sheet for Weighted Average Cost of Capital (WACC), featuring parameters like Beta, risk-free rate, and share price.
- DCF Valuation (Unlevered and Levered): Editable Discounted Cash Flow models illustrating intrinsic value with comprehensive calculations.
- Financial Statements: Pre-loaded financial statements (annual and quarterly) to facilitate analysis.
- Key Ratios: Includes profitability, leverage, and efficiency ratios for VeriSign, Inc. (VRSN).
- Dashboard and Charts: Visual summary of valuation outputs and assumptions for easy result analysis.
Disclaimer
All information, articles, and product details provided on this website are for general informational and educational purposes only. We do not claim any ownership over, nor do we intend to infringe upon, any trademarks, copyrights, logos, brand names, or other intellectual property mentioned or depicted on this site. Such intellectual property remains the property of its respective owners, and any references here are made solely for identification or informational purposes, without implying any affiliation, endorsement, or partnership.
We make no representations or warranties, express or implied, regarding the accuracy, completeness, or suitability of any content or products presented. Nothing on this website should be construed as legal, tax, investment, financial, medical, or other professional advice. In addition, no part of this site—including articles or product references—constitutes a solicitation, recommendation, endorsement, advertisement, or offer to buy or sell any securities, franchises, or other financial instruments, particularly in jurisdictions where such activity would be unlawful.
All content is of a general nature and may not address the specific circumstances of any individual or entity. It is not a substitute for professional advice or services. Any actions you take based on the information provided here are strictly at your own risk. You accept full responsibility for any decisions or outcomes arising from your use of this website and agree to release us from any liability in connection with your use of, or reliance upon, the content or products found herein.