
|
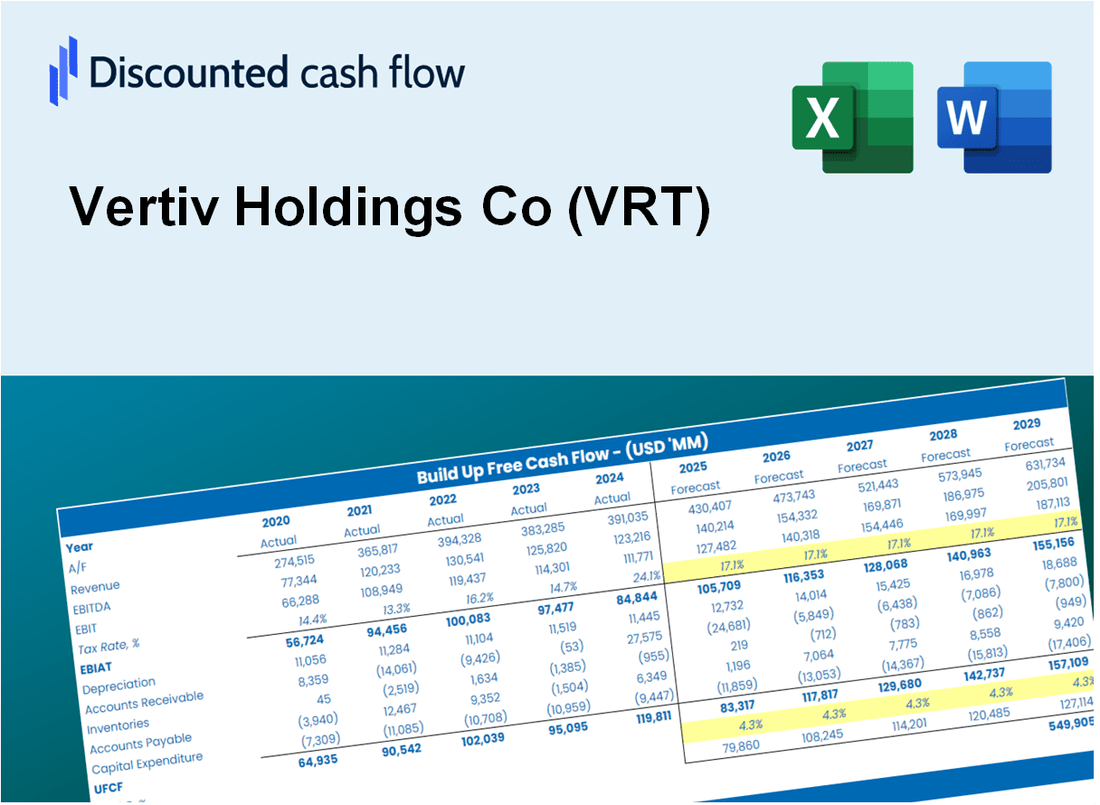
Vertiv Holdings Co (VRT) DCF -Bewertung |
Fully Editable: Tailor To Your Needs In Excel Or Sheets
Professional Design: Trusted, Industry-Standard Templates
Investor-Approved Valuation Models
MAC/PC Compatible, Fully Unlocked
No Expertise Is Needed; Easy To Follow
Vertiv Holdings Co (VRT) Bundle
Entdecken Sie das wahre Potenzial von Vertiv Holdings Co (VRT) mit unserem fortschrittlichen DCF -Taschenrechner! Passen Sie die kritischen Annahmen an, erkunden Sie verschiedene Szenarien und bewerten Sie, wie Änderungen die Bewertung von Vertiv Holdings Co (VRT) beeinflussen - alles innerhalb einer bequemen Excel -Vorlage.
What You Will Receive
- Customizable Excel Template: A fully adjustable Excel-based DCF Calculator featuring pre-filled financial data for VRT.
- Authentic Financial Data: Access to historical performance metrics and future projections (highlighted in the yellow cells).
- Adaptable Forecasting: Modify key assumptions such as revenue growth, EBITDA %, and WACC.
- Instant Calculations: Quickly observe how your inputs influence the valuation of Vertiv Holdings Co.
- Professional Resource: Designed for investors, CFOs, consultants, and financial analysts.
- Intuitive Layout: Organized for simplicity and ease of navigation, complete with step-by-step guidance.
Key Features
- Comprehensive DCF Calculator: Features detailed unlevered and levered DCF valuation models tailored for Vertiv Holdings Co (VRT).
- WACC Calculator: Pre-designed Weighted Average Cost of Capital sheet with adjustable inputs specific to Vertiv.
- Customizable Forecast Assumptions: Adjust growth rates, capital expenditures, and discount rates to fit your analysis needs.
- Integrated Financial Ratios: Evaluate profitability, leverage, and efficiency ratios relevant to Vertiv Holdings Co (VRT).
- User-Friendly Dashboard and Charts: Visual representations summarize essential valuation metrics for straightforward analysis.
How It Works
- Step 1: Download the Excel file.
- Step 2: Review pre-entered Vertiv Holdings Co (VRT) data (historical and projected).
- Step 3: Adjust key assumptions (yellow cells) based on your analysis.
- Step 4: View automatic recalculations for Vertiv Holdings Co (VRT)’s intrinsic value.
- Step 5: Use the outputs for investment decisions or reporting.
Why Choose This Calculator for Vertiv Holdings Co (VRT)?
- Accurate Data: Utilize real financials from Vertiv Holdings Co for trustworthy valuation outcomes.
- Customizable: Tailor essential parameters such as growth rates, WACC, and tax rates to fit your forecasts.
- Time-Saving: Pre-configured calculations save you the hassle of starting from scratch.
- Professional-Grade Tool: Crafted for investors, analysts, and consultants focusing on Vertiv Holdings Co.
- User-Friendly: An intuitive design and clear, step-by-step guidance make it accessible for everyone.
Who Should Use This Product?
- Investors: Evaluate Vertiv Holdings Co's (VRT) market position before making investment decisions.
- CFOs and Financial Analysts: Enhance valuation methodologies and assess financial forecasts for Vertiv Holdings Co (VRT).
- Startup Founders: Understand the valuation principles applied to established companies like Vertiv Holdings Co (VRT).
- Consultants: Provide comprehensive valuation insights and reports for clients regarding Vertiv Holdings Co (VRT).
- Students and Educators: Utilize real-time data from Vertiv Holdings Co (VRT) to teach and practice valuation strategies.
What the Template Contains
- Preloaded VRT Data: Historical and projected financial data, including revenue, EBIT, and capital expenditures.
- DCF and WACC Models: Professional-grade sheets for calculating intrinsic value and Weighted Average Cost of Capital.
- Editable Inputs: Yellow-highlighted cells for adjusting revenue growth, tax rates, and discount rates.
- Financial Statements: Comprehensive annual and quarterly financials for deeper analysis.
- Key Ratios: Profitability, leverage, and efficiency ratios to evaluate performance.
- Dashboard and Charts: Visual summaries of valuation outcomes and assumptions.
Disclaimer
All information, articles, and product details provided on this website are for general informational and educational purposes only. We do not claim any ownership over, nor do we intend to infringe upon, any trademarks, copyrights, logos, brand names, or other intellectual property mentioned or depicted on this site. Such intellectual property remains the property of its respective owners, and any references here are made solely for identification or informational purposes, without implying any affiliation, endorsement, or partnership.
We make no representations or warranties, express or implied, regarding the accuracy, completeness, or suitability of any content or products presented. Nothing on this website should be construed as legal, tax, investment, financial, medical, or other professional advice. In addition, no part of this site—including articles or product references—constitutes a solicitation, recommendation, endorsement, advertisement, or offer to buy or sell any securities, franchises, or other financial instruments, particularly in jurisdictions where such activity would be unlawful.
All content is of a general nature and may not address the specific circumstances of any individual or entity. It is not a substitute for professional advice or services. Any actions you take based on the information provided here are strictly at your own risk. You accept full responsibility for any decisions or outcomes arising from your use of this website and agree to release us from any liability in connection with your use of, or reliance upon, the content or products found herein.