
|
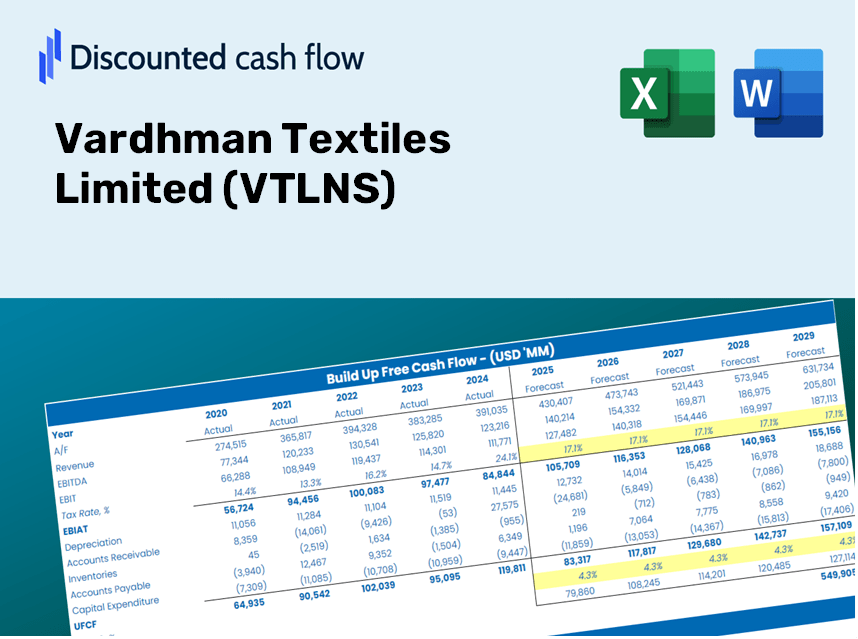
Vardhman Textiles Limited (VTL.NS) DCF -Bewertung |
Fully Editable: Tailor To Your Needs In Excel Or Sheets
Professional Design: Trusted, Industry-Standard Templates
Investor-Approved Valuation Models
MAC/PC Compatible, Fully Unlocked
No Expertise Is Needed; Easy To Follow
Vardhman Textiles Limited (VTL.NS) Bundle
Vereinfachen Sie die Bewertung von Vardhman Textiles Limited (VTLNS) mit diesem anpassbaren DCF -Taschenrechner! Mit Real Vardhman Textiles Limited (VTLNS) Finanzdaten und einstellbaren Prognoseeingaben können Sie Szenarien testen und Vardhman Textiles Limited (VTLNS) Fair -Wert in Minuten aufdecken.
Discounted Cash Flow (DCF) - (USD MM)
| Year | AY1 2021 |
AY2 2022 |
AY3 2023 |
AY4 2024 |
AY5 2025 |
FY1 2026 |
FY2 2027 |
FY3 2028 |
FY4 2029 |
FY5 2030 |
|---|---|---|---|---|---|---|---|---|---|---|
| Revenue | 61,398.7 | 96,223.4 | 101,374.9 | 95,046.8 | 97,848.8 | 112,227.3 | 128,718.6 | 147,633.3 | 169,327.4 | 194,209.4 |
| Revenue Growth, % | 0 | 56.72 | 5.35 | -6.24 | 2.95 | 14.69 | 14.69 | 14.69 | 14.69 | 14.69 |
| EBITDA | 8,488.2 | 23,111.1 | 13,805.9 | 10,367.9 | 13,201.3 | 17,027.4 | 19,529.5 | 22,399.3 | 25,690.8 | 29,466.0 |
| EBITDA, % | 13.82 | 24.02 | 13.62 | 10.91 | 13.49 | 15.17 | 15.17 | 15.17 | 15.17 | 15.17 |
| Depreciation | 3,623.9 | 3,665.5 | 3,936.3 | 4,037.5 | 3,999.4 | 4,922.2 | 5,645.5 | 6,475.1 | 7,426.6 | 8,517.9 |
| Depreciation, % | 5.9 | 3.81 | 3.88 | 4.25 | 4.09 | 4.39 | 4.39 | 4.39 | 4.39 | 4.39 |
| EBIT | 4,864.3 | 19,445.6 | 9,869.6 | 6,330.4 | 9,201.9 | 12,105.2 | 13,884.0 | 15,924.2 | 18,264.2 | 20,948.0 |
| EBIT, % | 7.92 | 20.21 | 9.74 | 6.66 | 9.4 | 10.79 | 10.79 | 10.79 | 10.79 | 10.79 |
| Total Cash | 7,136.2 | 7,231.3 | 15,153.1 | 2,795.4 | 5,515.4 | 9,575.9 | 10,983.1 | 12,597.0 | 14,448.1 | 16,571.2 |
| Total Cash, percent | .0 | .0 | .0 | .0 | .0 | .0 | .0 | .0 | .0 | .0 |
| Account Receivables | 12,738.2 | 17,209.7 | 13,845.7 | 14,052.7 | 12,997.1 | 18,036.6 | 20,687.0 | 23,726.9 | 27,213.5 | 31,212.4 |
| Account Receivables, % | 20.75 | 17.89 | 13.66 | 14.79 | 13.28 | 16.07 | 16.07 | 16.07 | 16.07 | 16.07 |
| Inventories | 27,960.5 | 28,822.9 | 23,926.8 | 41,798.9 | 37,614.8 | 40,741.8 | 46,728.6 | 53,595.2 | 61,470.8 | 70,503.7 |
| Inventories, % | 45.54 | 29.95 | 23.6 | 43.98 | 38.44 | 36.3 | 36.3 | 36.3 | 36.3 | 36.3 |
| Accounts Payable | 3,088.0 | 4,008.1 | 3,599.1 | 3,583.7 | 4,966.1 | 4,846.2 | 5,558.3 | 6,375.1 | 7,311.8 | 8,386.3 |
| Accounts Payable, % | 5.03 | 4.17 | 3.55 | 3.77 | 5.08 | 4.32 | 4.32 | 4.32 | 4.32 | 4.32 |
| Capital Expenditure | -2,430.2 | -5,190.7 | -6,217.4 | -2,840.3 | -10,326.2 | -6,515.3 | -7,472.7 | -8,570.7 | -9,830.2 | -11,274.7 |
| Capital Expenditure, % | -3.96 | -5.39 | -6.13 | -2.99 | -10.55 | -5.81 | -5.81 | -5.81 | -5.81 | -5.81 |
| Tax Rate, % | 24.39 | 24.39 | 24.39 | 24.39 | 24.39 | 24.39 | 24.39 | 24.39 | 24.39 | 24.39 |
| EBITAT | 3,606.2 | 14,526.7 | 7,404.3 | 4,788.7 | 6,957.3 | 9,081.7 | 10,416.2 | 11,946.8 | 13,702.3 | 15,715.8 |
| Depreciation | ||||||||||
| Changes in Account Receivables | ||||||||||
| Changes in Inventories | ||||||||||
| Changes in Accounts Payable | ||||||||||
| Capital Expenditure | ||||||||||
| UFCF | -32,810.8 | 8,587.7 | 12,974.3 | -12,108.6 | 7,252.6 | -797.8 | 663.9 | 761.5 | 873.4 | 1,001.7 |
| WACC, % | 4.68 | 4.68 | 4.68 | 4.69 | 4.69 | 4.68 | 4.68 | 4.68 | 4.68 | 4.68 |
| PV UFCF | ||||||||||
| SUM PV UFCF | 2,031.6 | |||||||||
| Long Term Growth Rate, % | 3.50 | |||||||||
| Free cash flow (T + 1) | 1,037 | |||||||||
| Terminal Value | 87,588 | |||||||||
| Present Terminal Value | 69,671 | |||||||||
| Enterprise Value | 71,702 | |||||||||
| Net Debt | 11,496 | |||||||||
| Equity Value | 60,206 | |||||||||
| Diluted Shares Outstanding, MM | 285 | |||||||||
| Equity Value Per Share | 211.61 |
Benefits You Will Receive
- Authentic VTLNS Financials: Access to comprehensive historical and projected data for precise valuation.
- Customizable Inputs: Adjust parameters such as WACC, tax rates, revenue growth, and capital expenditures.
- Real-Time Calculations: Intrinsic value and NPV are calculated automatically as you make changes.
- Scenario Analysis: Evaluate various scenarios to assess Vardhman Textiles Limited's future performance.
- User-Friendly Interface: Designed for professionals but easy for beginners to understand.
Key Features
- Accurate Financial Data: Gain access to reliable pre-loaded historical figures and future forecasts for Vardhman Textiles Limited (VTLNS).
- Tailored Forecast Assumptions: Modify highlighted cells for key metrics such as WACC, growth rates, and margins.
- Real-Time Calculations: Enjoy automatic updates for DCF, Net Present Value (NPV), and cash flow evaluations.
- User-Friendly Dashboard: View easy-to-understand charts and summaries that showcase your valuation findings.
- Designed for All Skill Levels: An intuitive layout that caters to investors, CFOs, and consultants, regardless of expertise.
How It Works
- Download: Get the ready-to-use Excel file containing Vardhman Textiles Limited's (VTLNS) financial data.
- Customize: Modify forecasts, such as revenue growth, EBITDA %, and WACC.
- Update Automatically: Intrinsic value and NPV calculations refresh in real-time.
- Test Scenarios: Develop various projections and instantly compare results.
- Make Decisions: Utilize the valuation outcomes to inform your investment approach.
Why Choose Vardhman Textiles Limited (VTLNS) Calculator?
- Time-Saving: Eliminate the hassle of building a DCF model from the ground up – it's immediately accessible.
- Enhanced Accuracy: Dependable financial data and formulas help minimize valuation errors.
- Customizable Options: Adjust the model to align with your specific assumptions and projections.
- User-Friendly Design: Intuitive charts and outputs simplify result interpretation.
- Endorsed by Industry Professionals: Crafted for experts who prioritize both precision and functionality.
Who Can Benefit from This Product?
- Professional Investors: Create comprehensive and dependable valuation models for portfolio evaluation related to Vardhman Textiles Limited (VTLNS).
- Corporate Finance Teams: Assess valuation scenarios to inform strategic decisions within their organizations.
- Consultants and Advisors: Equip clients with precise valuation insights for Vardhman Textiles Limited (VTLNS).
- Students and Educators: Utilize real-world data to enhance learning and practice in financial modeling.
- Textile Industry Enthusiasts: Gain insights into how companies like Vardhman Textiles Limited (VTLNS) are valued in the marketplace.
Contents of the Template
- Comprehensive DCF Model: Editable template featuring detailed valuation computations.
- Real-World Data: Vardhman Textiles Limited’s (VTLNS) historical and projected financials preloaded for in-depth analysis.
- Customizable Parameters: Modify WACC, growth rates, and tax assumptions to explore various scenarios.
- Financial Statements: Detailed annual and quarterly breakdowns for enhanced insights.
- Key Ratios: Integrated analysis for evaluating profitability, efficiency, and leverage.
- Dashboard with Visual Outputs: Engaging charts and tables that present clear, actionable results.
Disclaimer
All information, articles, and product details provided on this website are for general informational and educational purposes only. We do not claim any ownership over, nor do we intend to infringe upon, any trademarks, copyrights, logos, brand names, or other intellectual property mentioned or depicted on this site. Such intellectual property remains the property of its respective owners, and any references here are made solely for identification or informational purposes, without implying any affiliation, endorsement, or partnership.
We make no representations or warranties, express or implied, regarding the accuracy, completeness, or suitability of any content or products presented. Nothing on this website should be construed as legal, tax, investment, financial, medical, or other professional advice. In addition, no part of this site—including articles or product references—constitutes a solicitation, recommendation, endorsement, advertisement, or offer to buy or sell any securities, franchises, or other financial instruments, particularly in jurisdictions where such activity would be unlawful.
All content is of a general nature and may not address the specific circumstances of any individual or entity. It is not a substitute for professional advice or services. Any actions you take based on the information provided here are strictly at your own risk. You accept full responsibility for any decisions or outcomes arising from your use of this website and agree to release us from any liability in connection with your use of, or reliance upon, the content or products found herein.