
|
Ventyx Biosciences, Inc. (VTYX) DCF -Bewertung |
Fully Editable: Tailor To Your Needs In Excel Or Sheets
Professional Design: Trusted, Industry-Standard Templates
Investor-Approved Valuation Models
MAC/PC Compatible, Fully Unlocked
No Expertise Is Needed; Easy To Follow
Ventyx Biosciences, Inc. (VTYX) Bundle
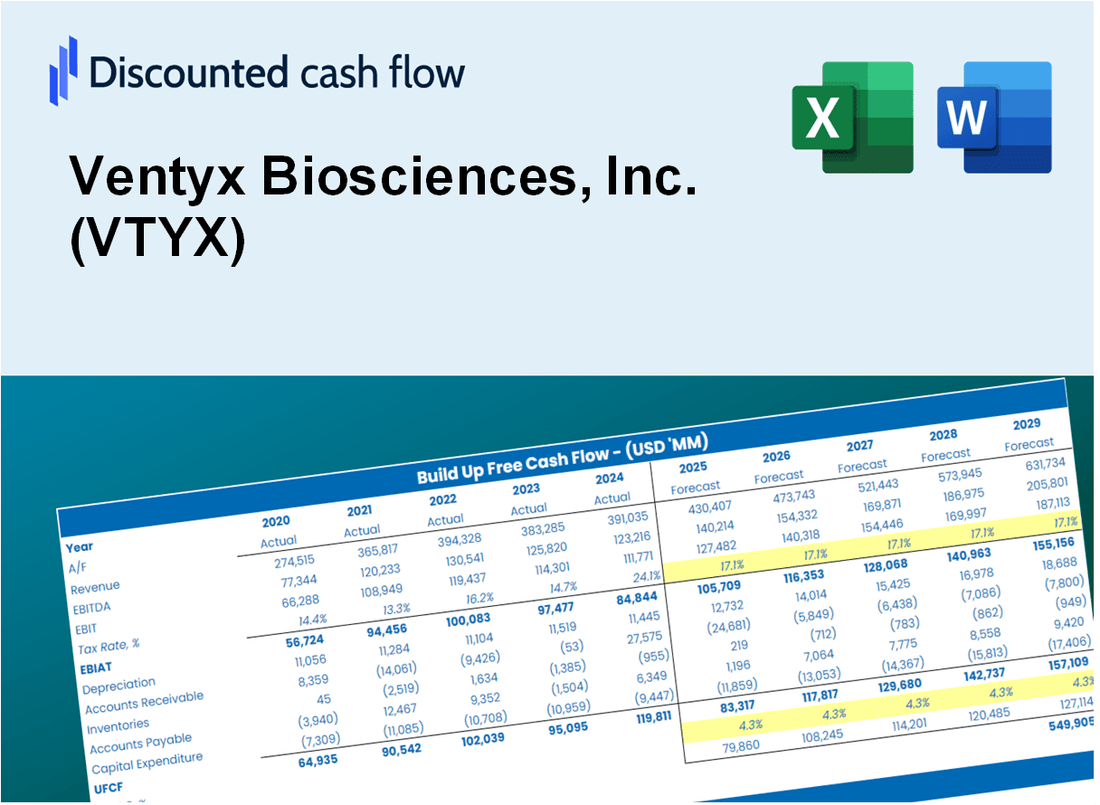
Entdecken Sie die finanzielle Zukunft von Ventyx Biosciences, Inc. (VTYX) mit unserem benutzerfreundlichen DCF-Taschenrechner! Geben Sie Ihre Projektionen für Wachstum, Margen und Kosten ein, um den inneren Wert von Ventyx Biosciences, Inc. (VTYX) zu berechnen und Ihre Anlagestrategie zu verfeinern.
Discounted Cash Flow (DCF) - (USD MM)
| Year | AY1 2020 |
AY2 2021 |
AY3 2022 |
AY4 2023 |
AY5 2024 |
FY1 2025 |
FY2 2026 |
FY3 2027 |
FY4 2028 |
FY5 2029 |
|---|---|---|---|---|---|---|---|---|---|---|
| Revenue | .0 | .0 | .0 | .0 | .0 | .0 | .0 | .0 | .0 | .0 |
| Revenue Growth, % | 0 | 0 | 0 | 0 | 0 | 0 | 0 | 0 | 0 | 0 |
| EBITDA | .0 | -83.6 | -112.7 | -207.1 | -147.1 | .0 | .0 | .0 | .0 | .0 |
| EBITDA, % | 100 | 100 | 100 | 100 | 100 | 100 | 100 | 100 | 100 | 100 |
| Depreciation | 7.1 | .0 | .5 | .9 | 1.3 | .0 | .0 | .0 | .0 | .0 |
| Depreciation, % | 100 | 100 | 100 | 100 | 100 | 100 | 100 | 100 | 100 | 100 |
| EBIT | -7.1 | -83.6 | -113.1 | -208.0 | -148.5 | .0 | .0 | .0 | .0 | .0 |
| EBIT, % | 100 | 100 | 100 | 100 | 100 | 100 | 100 | 100 | 100 | 100 |
| Total Cash | .2 | 258.6 | 317.9 | 252.2 | 217.3 | .0 | .0 | .0 | .0 | .0 |
| Total Cash, percent | .0 | .0 | .0 | .0 | .0 | .0 | .0 | .0 | .0 | .0 |
| Account Receivables | .0 | .0 | .0 | .0 | 1.0 | .0 | .0 | .0 | .0 | .0 |
| Account Receivables, % | 100 | 100 | 100 | 100 | 100 | 100 | 100 | 100 | 100 | 100 |
| Inventories | .0 | .0 | .0 | .0 | .0 | .0 | .0 | .0 | .0 | .0 |
| Inventories, % | 100 | 100 | 100 | 100 | 100 | 100 | 100 | 100 | 100 | 100 |
| Accounts Payable | 1.1 | 4.7 | 6.4 | 5.8 | 3.1 | .0 | .0 | .0 | .0 | .0 |
| Accounts Payable, % | 100 | 100 | 100 | 100 | 100 | 100 | 100 | 100 | 100 | 100 |
| Capital Expenditure | .0 | -.3 | -.3 | -.5 | -.2 | .0 | .0 | .0 | .0 | .0 |
| Capital Expenditure, % | 100 | 100 | 100 | 100 | 100 | 0 | 0 | 0 | 0 | 0 |
| Tax Rate, % | 0 | 0 | 0 | 0 | 0 | 0 | 0 | 0 | 0 | 0 |
| EBITAT | -7.1 | -83.6 | -113.1 | -208.0 | -148.5 | .0 | .0 | .0 | .0 | .0 |
| Depreciation | ||||||||||
| Changes in Account Receivables | ||||||||||
| Changes in Inventories | ||||||||||
| Changes in Accounts Payable | ||||||||||
| Capital Expenditure | ||||||||||
| UFCF | 1.1 | -80.3 | -111.2 | -208.2 | -151.0 | -2.1 | .0 | .0 | .0 | .0 |
| WACC, % | 9.48 | 9.48 | 9.48 | 9.48 | 9.48 | 9.48 | 9.48 | 9.48 | 9.48 | 9.48 |
| PV UFCF | ||||||||||
| SUM PV UFCF | -1.9 | |||||||||
| Long Term Growth Rate, % | 2.00 | |||||||||
| Free cash flow (T + 1) | 0 | |||||||||
| Terminal Value | 0 | |||||||||
| Present Terminal Value | 0 | |||||||||
| Enterprise Value | -2 | |||||||||
| Net Debt | -16 | |||||||||
| Equity Value | 15 | |||||||||
| Diluted Shares Outstanding, MM | 68 | |||||||||
| Equity Value Per Share | 0.21 |
What You Will Get
- Editable Forecast Inputs: Effortlessly modify key assumptions (growth %, margins, WACC) to explore various scenarios.
- Real-World Data: Ventyx Biosciences, Inc. (VTYX) financial data pre-loaded to facilitate your analysis.
- Automatic DCF Outputs: The template computes Net Present Value (NPV) and intrinsic value automatically.
- Customizable and Professional: A sleek Excel model that adjusts to your valuation requirements.
- Built for Analysts and Investors: Perfect for evaluating projections, confirming strategies, and enhancing efficiency.
Key Features
- 🔍 Real-Life VTYX Financials: Pre-filled historical and projected data for Ventyx Biosciences, Inc. (VTYX).
- ✏️ Fully Customizable Inputs: Adjust all critical parameters (yellow cells) like WACC, growth %, and tax rates.
- 📊 Professional DCF Valuation: Built-in formulas calculate Ventyx’s intrinsic value using the Discounted Cash Flow method.
- ⚡ Instant Results: Visualize Ventyx’s valuation instantly after making changes.
- Scenario Analysis: Test and compare outcomes for various financial assumptions side-by-side.
How It Works
- 1. Download the Template: Obtain and open the Excel file featuring Ventyx Biosciences, Inc.'s (VTYX) preloaded data.
- 2. Modify Assumptions: Adjust critical inputs such as growth projections, WACC, and capital expenditures.
- 3. Analyze Results Immediately: The DCF model automatically computes intrinsic value and NPV based on your inputs.
- 4. Explore Scenarios: Evaluate various forecasts to understand different valuation results.
- 5. Present with Assurance: Share professional valuation insights to back your strategic decisions.
Why Choose This Calculator for Ventyx Biosciences, Inc. (VTYX)?
- Designed for Industry Experts: A sophisticated tool utilized by biotech analysts, CFOs, and investment consultants.
- Comprehensive Data: Ventyx’s historical and projected financials are preloaded for enhanced precision.
- Flexible Scenario Analysis: Effortlessly simulate various forecasts and assumptions.
- Insightful Outputs: Automatically computes intrinsic value, NPV, and essential metrics.
- User-Friendly: Detailed, step-by-step instructions make the process straightforward.
Who Should Use This Product?
- Healthcare Investors: Develop comprehensive valuation models for assessing investments in biotech companies.
- Corporate Strategy Teams: Evaluate valuation scenarios to inform strategic decisions within the organization.
- Financial Consultants: Deliver precise valuation insights for Ventyx Biosciences, Inc. (VTYX) to clients.
- Academic Professionals: Utilize real-world data for teaching and practicing financial analysis in biotechnology.
- Biotech Enthusiasts: Gain insights into how biotech firms like Ventyx Biosciences, Inc. (VTYX) are appraised in the market.
What the Template Contains
- Historical Data: Includes Ventyx Biosciences’ past financials and baseline forecasts.
- DCF and Levered DCF Models: Detailed templates to calculate Ventyx Biosciences’ intrinsic value.
- WACC Sheet: Pre-built calculations for Weighted Average Cost of Capital.
- Editable Inputs: Modify key drivers like growth rates, EBITDA %, and CAPEX assumptions.
- Quarterly and Annual Statements: A complete breakdown of Ventyx Biosciences’ financials.
- Interactive Dashboard: Visualize valuation results and projections dynamically.
Disclaimer
All information, articles, and product details provided on this website are for general informational and educational purposes only. We do not claim any ownership over, nor do we intend to infringe upon, any trademarks, copyrights, logos, brand names, or other intellectual property mentioned or depicted on this site. Such intellectual property remains the property of its respective owners, and any references here are made solely for identification or informational purposes, without implying any affiliation, endorsement, or partnership.
We make no representations or warranties, express or implied, regarding the accuracy, completeness, or suitability of any content or products presented. Nothing on this website should be construed as legal, tax, investment, financial, medical, or other professional advice. In addition, no part of this site—including articles or product references—constitutes a solicitation, recommendation, endorsement, advertisement, or offer to buy or sell any securities, franchises, or other financial instruments, particularly in jurisdictions where such activity would be unlawful.
All content is of a general nature and may not address the specific circumstances of any individual or entity. It is not a substitute for professional advice or services. Any actions you take based on the information provided here are strictly at your own risk. You accept full responsibility for any decisions or outcomes arising from your use of this website and agree to release us from any liability in connection with your use of, or reliance upon, the content or products found herein.