
|
Welltower Inc. (gut) DCF -Bewertung |
Fully Editable: Tailor To Your Needs In Excel Or Sheets
Professional Design: Trusted, Industry-Standard Templates
Investor-Approved Valuation Models
MAC/PC Compatible, Fully Unlocked
No Expertise Is Needed; Easy To Follow
Welltower Inc. (WELL) Bundle
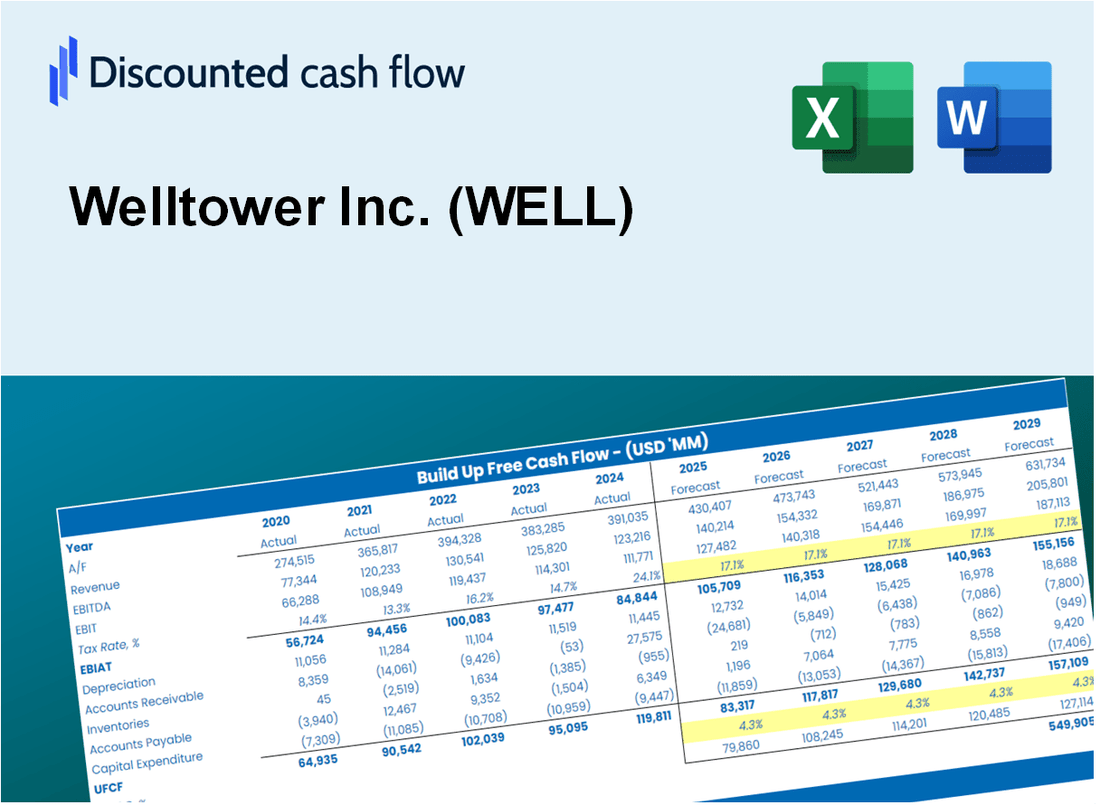
Unser (gutem) DCF-Taschenrechner entwickelt für die Genauigkeit und ermöglicht es Ihnen, die Bewertung von Welltower Inc. anhand von Finanzdaten mit realen Welt zu bewerten und gleichzeitig vollständige Flexibilität zu bieten, um alle wesentlichen Parameter für erweiterte Projektionen zu ändern.
What You Will Receive
- Pre-Filled Financial Model: Welltower Inc.'s (WELL) actual data facilitates accurate DCF valuation.
- Comprehensive Forecast Control: Modify revenue growth, margins, WACC, and other essential drivers.
- Real-Time Calculations: Automatic updates provide immediate results as adjustments are made.
- Professional-Grade Template: A polished Excel file crafted for high-quality valuation.
- Flexible and Reusable: Designed for adaptability, allowing for repeated use in detailed forecasts.
Key Features
- Real-Life WELL Data: Pre-filled with Welltower’s historical financials and future projections.
- Fully Customizable Inputs: Modify revenue growth, margins, WACC, tax rates, and capital expenditures.
- Dynamic Valuation Model: Automatic updates to Net Present Value (NPV) and intrinsic value based on your inputs.
- Scenario Testing: Generate multiple forecast scenarios to evaluate different valuation outcomes.
- User-Friendly Design: Intuitive, structured, and tailored for both professionals and newcomers.
How It Works
- 1. Access the Template: Download and open the Excel file containing Welltower Inc.'s (WELL) foundational data.
- 2. Adjust Key Inputs: Modify essential variables such as occupancy rates, revenue growth, and operating expenses.
- 3. Analyze Results Immediately: The DCF model automatically computes intrinsic value and NPV based on your inputs.
- 4. Explore Different Scenarios: Evaluate various projections to understand potential valuation variations.
- 5. Present with Assurance: Deliver professional valuation analyses to reinforce your investment strategies.
Why Choose This Calculator for Welltower Inc. (WELL)?
- Comprehensive Tool: Integrates DCF, WACC, and financial ratio analyses tailored for real estate investment trusts.
- Customizable Inputs: Modify yellow-highlighted cells to explore different investment scenarios.
- Detailed Insights: Automatically computes Welltower’s intrinsic value and Net Present Value.
- Preloaded Data: Historical and projected data provide reliable starting points for analysis.
- Professional Quality: Perfect for real estate analysts, investors, and financial consultants.
Who Should Use This Product?
- Healthcare Students: Understand valuation methods and apply them to real-world healthcare data.
- Researchers: Integrate established models into your studies or academic projects.
- Investors: Validate your investment strategies and assess valuation outcomes for Welltower Inc. (WELL).
- Financial Analysts: Enhance efficiency with a customizable DCF model tailored for real estate investment trusts.
- Real Estate Professionals: Discover how major healthcare REITs like Welltower Inc. (WELL) are evaluated in the market.
What the Template Contains
- Historical Data: Includes Welltower Inc.’s past financials and baseline forecasts.
- DCF and Levered DCF Models: Detailed templates to calculate Welltower Inc.’s intrinsic value.
- WACC Sheet: Pre-built calculations for Weighted Average Cost of Capital.
- Editable Inputs: Modify key drivers like growth rates, EBITDA %, and CAPEX assumptions.
- Quarterly and Annual Statements: A complete breakdown of Welltower Inc.’s financials.
- Interactive Dashboard: Visualize valuation results and projections dynamically.
Disclaimer
All information, articles, and product details provided on this website are for general informational and educational purposes only. We do not claim any ownership over, nor do we intend to infringe upon, any trademarks, copyrights, logos, brand names, or other intellectual property mentioned or depicted on this site. Such intellectual property remains the property of its respective owners, and any references here are made solely for identification or informational purposes, without implying any affiliation, endorsement, or partnership.
We make no representations or warranties, express or implied, regarding the accuracy, completeness, or suitability of any content or products presented. Nothing on this website should be construed as legal, tax, investment, financial, medical, or other professional advice. In addition, no part of this site—including articles or product references—constitutes a solicitation, recommendation, endorsement, advertisement, or offer to buy or sell any securities, franchises, or other financial instruments, particularly in jurisdictions where such activity would be unlawful.
All content is of a general nature and may not address the specific circumstances of any individual or entity. It is not a substitute for professional advice or services. Any actions you take based on the information provided here are strictly at your own risk. You accept full responsibility for any decisions or outcomes arising from your use of this website and agree to release us from any liability in connection with your use of, or reliance upon, the content or products found herein.