
|
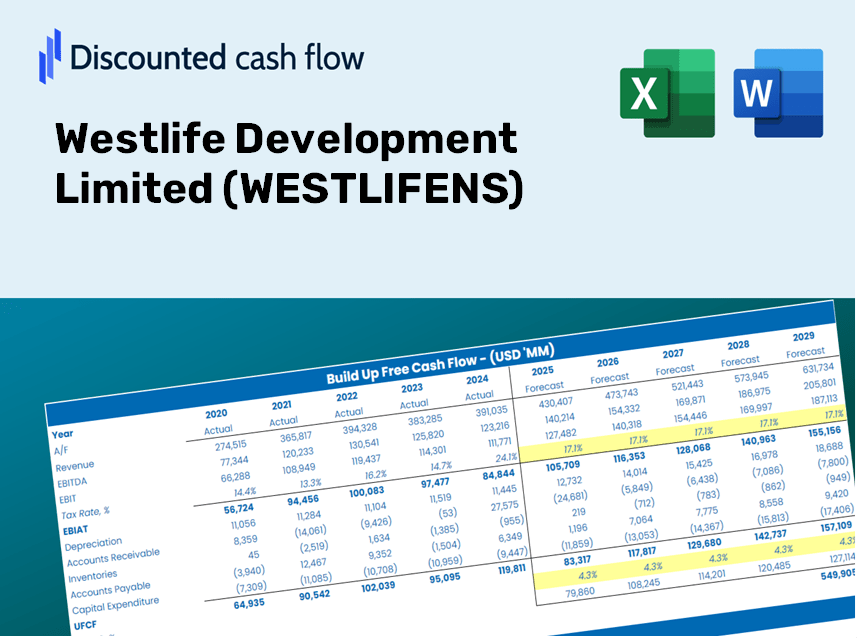
Westlife Development Limited (Westlife.NS) DCF -Bewertung |
Fully Editable: Tailor To Your Needs In Excel Or Sheets
Professional Design: Trusted, Industry-Standard Templates
Investor-Approved Valuation Models
MAC/PC Compatible, Fully Unlocked
No Expertise Is Needed; Easy To Follow
Westlife Foodworld Limited (WESTLIFE.NS) Bundle
Unabhängig davon, ob Sie ein Investor oder Analyst sind, ist dieser (Westlifens) DCF-Taschenrechner Ihr Anlaufwerk für eine genaue Bewertung. Mit realen Daten von Westlife Development Limited geladen, können Sie Prognosen anpassen und die Auswirkungen sofort beobachten.
Discounted Cash Flow (DCF) - (USD MM)
| Year | AY1 2021 |
AY2 2022 |
AY3 2023 |
AY4 2024 |
AY5 2025 |
FY1 2026 |
FY2 2027 |
FY3 2028 |
FY4 2029 |
FY5 2030 |
|---|---|---|---|---|---|---|---|---|---|---|
| Revenue | 9,752.5 | 15,560.9 | 22,594.0 | 23,682.2 | 24,741.3 | 31,795.3 | 40,860.4 | 52,510.0 | 67,481.1 | 86,720.6 |
| Revenue Growth, % | 0 | 59.56 | 45.2 | 4.82 | 4.47 | 28.51 | 28.51 | 28.51 | 28.51 | 28.51 |
| EBITDA | 954.4 | 2,169.6 | 3,943.9 | 3,877.9 | 3,187.7 | 4,479.5 | 5,756.6 | 7,397.9 | 9,507.1 | 12,217.7 |
| EBITDA, % | 9.79 | 13.94 | 17.46 | 16.37 | 12.88 | 14.09 | 14.09 | 14.09 | 14.09 | 14.09 |
| Depreciation | 1,396.5 | 1,364.0 | 1,521.9 | 1,822.2 | 2,041.0 | 2,910.2 | 3,739.9 | 4,806.1 | 6,176.4 | 7,937.4 |
| Depreciation, % | 14.32 | 8.77 | 6.74 | 7.69 | 8.25 | 9.15 | 9.15 | 9.15 | 9.15 | 9.15 |
| EBIT | -442.1 | 805.6 | 2,422.0 | 2,055.7 | 1,146.7 | 1,569.3 | 2,016.8 | 2,591.8 | 3,330.7 | 4,280.3 |
| EBIT, % | -4.53 | 5.18 | 10.72 | 8.68 | 4.63 | 4.94 | 4.94 | 4.94 | 4.94 | 4.94 |
| Total Cash | 1,571.0 | 1,740.3 | 284.1 | 876.1 | 589.4 | 2,202.2 | 2,830.1 | 3,637.0 | 4,673.9 | 6,006.5 |
| Total Cash, percent | .0 | .0 | .0 | .0 | .0 | .0 | .0 | .0 | .0 | .0 |
| Account Receivables | 111.1 | 133.1 | 183.4 | 176.0 | 195.5 | 275.9 | 354.6 | 455.7 | 585.6 | 752.6 |
| Account Receivables, % | 1.14 | 0.85516 | 0.81154 | 0.7433 | 0.79019 | 0.86779 | 0.86779 | 0.86779 | 0.86779 | 0.86779 |
| Inventories | 465.3 | 559.5 | 714.3 | 632.4 | 807.6 | 1,110.4 | 1,427.0 | 1,833.9 | 2,356.7 | 3,028.6 |
| Inventories, % | 4.77 | 3.6 | 3.16 | 2.67 | 3.26 | 3.49 | 3.49 | 3.49 | 3.49 | 3.49 |
| Accounts Payable | 1,850.6 | 1,722.3 | 1,876.7 | 2,026.0 | 2,324.8 | 3,580.2 | 4,601.0 | 5,912.7 | 7,598.5 | 9,764.9 |
| Accounts Payable, % | 18.98 | 11.07 | 8.31 | 8.55 | 9.4 | 11.26 | 11.26 | 11.26 | 11.26 | 11.26 |
| Capital Expenditure | -500.3 | -1,000.8 | -2,696.3 | -2,166.3 | -2,177.1 | -2,635.3 | -3,386.7 | -4,352.3 | -5,593.1 | -7,187.8 |
| Capital Expenditure, % | -5.13 | -6.43 | -11.93 | -9.15 | -8.8 | -8.29 | -8.29 | -8.29 | -8.29 | -8.29 |
| Tax Rate, % | 6.89 | 6.89 | 6.89 | 6.89 | 6.89 | 6.89 | 6.89 | 6.89 | 6.89 | 6.89 |
| EBITAT | -341.4 | 649.7 | 1,808.2 | 1,484.4 | 1,067.7 | 1,248.7 | 1,604.7 | 2,062.3 | 2,650.2 | 3,405.9 |
| Depreciation | ||||||||||
| Changes in Account Receivables | ||||||||||
| Changes in Inventories | ||||||||||
| Changes in Accounts Payable | ||||||||||
| Capital Expenditure | ||||||||||
| UFCF | 1,828.9 | 768.3 | 583.2 | 1,378.9 | 1,035.7 | 2,395.8 | 2,583.4 | 3,320.0 | 4,266.5 | 5,482.9 |
| WACC, % | 4.9 | 4.95 | 4.87 | 4.84 | 5.1 | 4.93 | 4.93 | 4.93 | 4.93 | 4.93 |
| PV UFCF | ||||||||||
| SUM PV UFCF | 15,331.7 | |||||||||
| Long Term Growth Rate, % | 4.00 | |||||||||
| Free cash flow (T + 1) | 5,702 | |||||||||
| Terminal Value | 611,271 | |||||||||
| Present Terminal Value | 480,481 | |||||||||
| Enterprise Value | 495,812 | |||||||||
| Net Debt | 15,642 | |||||||||
| Equity Value | 480,170 | |||||||||
| Diluted Shares Outstanding, MM | 156 | |||||||||
| Equity Value Per Share | 3,083.41 |
What You Will Receive
- Authentic Westlife Data: Comprehensive financials – from revenue to EBIT – derived from actual and projected figures.
- Complete Customization: Modify key parameters (yellow cells) such as WACC, growth %, and tax rates to fit your analysis.
- Real-Time Valuation Adjustments: Automatic updates to assess the effects of changes on Westlife Development Limited’s (WESTLIFENS) fair value.
- Flexible Excel Template: Designed for quick modifications, scenario analysis, and in-depth projections.
- Efficient and Precise: Avoid the hassle of building models from the ground up while ensuring accuracy and adaptability.
Key Features
- Accurate Financial Data for Westlife Development Limited: Gain access to reliable, pre-loaded historical figures and future forecasts.
- Customizable Assumptions: Modify the highlighted cells, including WACC, growth rates, and profit margins.
- Real-Time Calculations: Automatic updates for DCF, Net Present Value (NPV), and cash flow assessments.
- Comprehensive Visual Dashboard: User-friendly charts and summaries designed to help you visualize valuation outcomes.
- Designed for Everyone: An intuitive framework suitable for investors, CFOs, and consultants, whether experienced or just starting out.
How It Functions
- 1. Access the Template: Download and open the Excel file containing Westlife Development Limited's (WESTLIFENS) preloaded data.
- 2. Modify Assumptions: Adjust essential inputs such as growth rates, WACC, and capital expenditures.
- 3. Instant Results: The DCF model automatically calculates intrinsic value and NPV in real-time.
- 4. Explore Scenarios: Evaluate various forecasts to understand different valuation possibilities.
- 5. Present with Assurance: Deliver professional valuation insights to inform your strategic decisions.
Why Choose the Westlife Development Limited (WESTLIFENS) Calculator?
- Precision: Utilizes authentic Westlife financial data for reliable accuracy.
- Adaptability: Built for users to easily experiment with and adjust inputs.
- Efficiency: Eliminate the need to construct a DCF model from the ground up.
- Expert-Level: Crafted with the expertise and usability of CFOs in focus.
- Intuitive: Simple to navigate, even for those lacking advanced financial modeling skills.
Who Should Benefit from This Product?
- Finance Students: Master valuation strategies and apply them using actual market data.
- Academics: Utilize industry-standard models in your teaching or research projects.
- Investors: Evaluate your hypotheses and analyze valuation results for Westlife Development Limited (WESTLIFENS) stock.
- Analysts: Enhance your productivity with a ready-made, customizable DCF model.
- Small Business Owners: Discover how major public companies like Westlife Development Limited (WESTLIFENS) are assessed in the market.
Contents of the Template
- Pre-Filled DCF Model: Financial data for Westlife Development Limited (WESTLIFENS) ready for immediate use.
- WACC Calculator: Comprehensive calculations for the Weighted Average Cost of Capital.
- Financial Ratios: Analyze Westlife Development’s profitability, leverage, and operational efficiency.
- Editable Inputs: Modify assumptions such as growth rates, margins, and capital expenditures to suit your specific scenarios.
- Financial Statements: Access annual and quarterly reports to facilitate thorough analysis.
- Interactive Dashboard: Effortlessly visualize key valuation metrics and outcomes.
Disclaimer
All information, articles, and product details provided on this website are for general informational and educational purposes only. We do not claim any ownership over, nor do we intend to infringe upon, any trademarks, copyrights, logos, brand names, or other intellectual property mentioned or depicted on this site. Such intellectual property remains the property of its respective owners, and any references here are made solely for identification or informational purposes, without implying any affiliation, endorsement, or partnership.
We make no representations or warranties, express or implied, regarding the accuracy, completeness, or suitability of any content or products presented. Nothing on this website should be construed as legal, tax, investment, financial, medical, or other professional advice. In addition, no part of this site—including articles or product references—constitutes a solicitation, recommendation, endorsement, advertisement, or offer to buy or sell any securities, franchises, or other financial instruments, particularly in jurisdictions where such activity would be unlawful.
All content is of a general nature and may not address the specific circumstances of any individual or entity. It is not a substitute for professional advice or services. Any actions you take based on the information provided here are strictly at your own risk. You accept full responsibility for any decisions or outcomes arising from your use of this website and agree to release us from any liability in connection with your use of, or reliance upon, the content or products found herein.