
|
Winnebago Industries, Inc. (WGO) DCF -Bewertung |
Fully Editable: Tailor To Your Needs In Excel Or Sheets
Professional Design: Trusted, Industry-Standard Templates
Investor-Approved Valuation Models
MAC/PC Compatible, Fully Unlocked
No Expertise Is Needed; Easy To Follow
Winnebago Industries, Inc. (WGO) Bundle
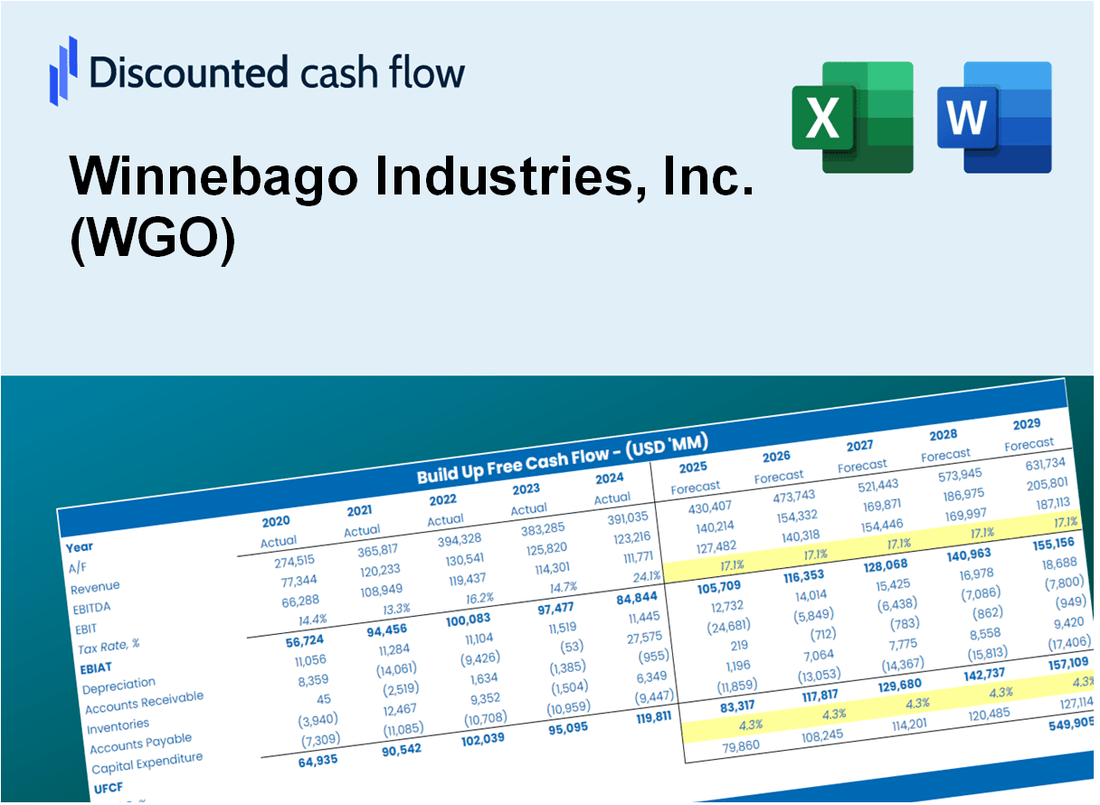
Vereinfachen Sie die Bewertung von Winnebago Industries, Inc. (WGO) mit diesem anpassbaren DCF -Taschenrechner! Mit Real Winnebago Industries, Inc. (WGO) Finanzdaten und einstellbaren Prognoseeingaben können Sie Szenarien testen und Winnebago Industries, Inc. (WGO) in Minuten aufdecken.
Discounted Cash Flow (DCF) - (USD MM)
| Year | AY1 2021 |
AY2 2022 |
AY3 2023 |
AY4 2024 |
AY5 2025 |
FY1 2026 |
FY2 2027 |
FY3 2028 |
FY4 2029 |
FY5 2030 |
|---|---|---|---|---|---|---|---|---|---|---|
| Revenue | 3,629.8 | 4,957.7 | 3,490.7 | 2,973.5 | 2,798.2 | 2,702.2 | 2,609.5 | 2,520.0 | 2,433.6 | 2,350.1 |
| Revenue Growth, % | 0 | 36.58 | -29.59 | -14.82 | -5.9 | -3.43 | -3.43 | -3.43 | -3.43 | -3.43 |
| EBITDA | 440.7 | 609.7 | 346.6 | 118.1 | 94.5 | 225.5 | 217.7 | 210.3 | 203.0 | 196.1 |
| EBITDA, % | 12.14 | 12.3 | 9.93 | 3.97 | 3.38 | 8.34 | 8.34 | 8.34 | 8.34 | 8.34 |
| Depreciation | 32.6 | 53.7 | 46.9 | 58.6 | 38.5 | 36.0 | 34.8 | 33.6 | 32.5 | 31.3 |
| Depreciation, % | 0.89706 | 1.08 | 1.34 | 1.97 | 1.38 | 1.33 | 1.33 | 1.33 | 1.33 | 1.33 |
| EBIT | 408.1 | 556.0 | 299.7 | 59.5 | 56.0 | 189.4 | 182.9 | 176.6 | 170.6 | 164.7 |
| EBIT, % | 11.24 | 11.22 | 8.59 | 2 | 2 | 7.01 | 7.01 | 7.01 | 7.01 | 7.01 |
| Total Cash | 434.6 | 282.2 | 309.9 | 330.9 | 174.0 | 237.2 | 229.1 | 221.2 | 213.6 | 206.3 |
| Total Cash, percent | .0 | .0 | .0 | .0 | .0 | .0 | .0 | .0 | .0 | .0 |
| Account Receivables | 253.8 | 254.1 | 178.5 | 183.5 | .0 | 126.5 | 122.1 | 118.0 | 113.9 | 110.0 |
| Account Receivables, % | 6.99 | 5.13 | 5.11 | 6.17 | 0 | 4.68 | 4.68 | 4.68 | 4.68 | 4.68 |
| Inventories | 341.5 | 525.8 | 470.6 | 438.7 | 396.4 | 337.3 | 325.7 | 314.6 | 303.8 | 293.4 |
| Inventories, % | 9.41 | 10.61 | 13.48 | 14.75 | 14.17 | 12.48 | 12.48 | 12.48 | 12.48 | 12.48 |
| Accounts Payable | 180.0 | 217.5 | 146.9 | 144.7 | 129.3 | 124.5 | 120.3 | 116.1 | 112.1 | 108.3 |
| Accounts Payable, % | 4.96 | 4.39 | 4.21 | 4.87 | 4.62 | 4.61 | 4.61 | 4.61 | 4.61 | 4.61 |
| Capital Expenditure | -44.9 | -88.0 | -83.2 | -45.0 | -39.4 | -44.9 | -43.4 | -41.9 | -40.5 | -39.1 |
| Capital Expenditure, % | -1.24 | -1.77 | -2.38 | -1.51 | -1.41 | -1.66 | -1.66 | -1.66 | -1.66 | -1.66 |
| Tax Rate, % | 14.62 | 14.62 | 14.62 | 14.62 | 14.62 | 14.62 | 14.62 | 14.62 | 14.62 | 14.62 |
| EBITAT | 313.1 | 422.0 | 231.8 | 20.1 | 47.8 | 132.3 | 127.7 | 123.4 | 119.1 | 115.0 |
| Depreciation | ||||||||||
| Changes in Account Receivables | ||||||||||
| Changes in Inventories | ||||||||||
| Changes in Accounts Payable | ||||||||||
| Capital Expenditure | ||||||||||
| UFCF | -114.5 | 240.5 | 255.7 | 58.4 | 257.3 | 51.2 | 130.8 | 126.3 | 122.0 | 117.8 |
| WACC, % | 10.6 | 10.59 | 10.62 | 9.6 | 10.81 | 10.44 | 10.44 | 10.44 | 10.44 | 10.44 |
| PV UFCF | ||||||||||
| SUM PV UFCF | 401.0 | |||||||||
| Long Term Growth Rate, % | 0.50 | |||||||||
| Free cash flow (T + 1) | 118 | |||||||||
| Terminal Value | 1,190 | |||||||||
| Present Terminal Value | 724 | |||||||||
| Enterprise Value | 1,125 | |||||||||
| Net Debt | -135 | |||||||||
| Equity Value | 1,260 | |||||||||
| Diluted Shares Outstanding, MM | 28 | |||||||||
| Equity Value Per Share | 44.53 |
What You Will Get
- Pre-Filled Financial Model: Winnebago’s actual data facilitates accurate DCF valuation.
- Full Forecast Control: Modify revenue growth, margins, WACC, and other essential drivers.
- Instant Calculations: Automatic updates provide real-time results as you make adjustments.
- Investor-Ready Template: A polished Excel file crafted for high-quality valuation.
- Customizable and Reusable: Designed for versatility, allowing repeated application for in-depth forecasts.
Key Features
- Comprehensive Financial Data: Winnebago Industries' historical financial statements and pre-filled projections.
- Customizable Parameters: Adjust WACC, tax rates, revenue growth, and EBITDA margins as needed.
- Real-Time Analysis: View Winnebago's intrinsic value update instantly.
- Intuitive Visualizations: Dashboard graphs showcase valuation results and essential metrics.
- Designed for Precision: A robust tool tailored for analysts, investors, and finance professionals.
How It Works
- Step 1: Download the Excel file.
- Step 2: Review pre-entered Winnebago data (historical and projected).
- Step 3: Adjust key assumptions (yellow cells) based on your analysis.
- Step 4: View automatic recalculations for Winnebago’s intrinsic value.
- Step 5: Use the outputs for investment decisions or reporting.
Why Choose This Calculator?
- Designed for Industry Experts: A sophisticated tool favored by analysts, CFOs, and consultants in the recreational vehicle sector.
- Comprehensive Data: Winnebago's historical and projected financials preloaded for enhanced accuracy.
- Flexible Scenario Analysis: Effortlessly simulate various forecasts and assumptions.
- Insightful Outputs: Automatically computes intrinsic value, NPV, and essential metrics.
- User-Friendly Interface: Step-by-step guidance makes the process straightforward.
Who Should Use This Product?
- Investors: Evaluate Winnebago's valuation before making stock transactions.
- CFOs and Financial Analysts: Enhance valuation workflows and assess financial forecasts.
- Startup Founders: Discover how established companies like Winnebago are appraised.
- Consultants: Provide detailed valuation reports for your clients.
- Students and Educators: Utilize real-world examples to learn and teach valuation methodologies.
What the Template Contains
- Pre-Filled Data: Includes Winnebago Industries’ historical financials and forecasts.
- Discounted Cash Flow Model: Editable DCF valuation model with automatic calculations.
- Weighted Average Cost of Capital (WACC): A dedicated sheet for calculating WACC based on custom inputs.
- Key Financial Ratios: Analyze Winnebago Industries’ profitability, efficiency, and leverage.
- Customizable Inputs: Edit revenue growth, margins, and tax rates with ease.
- Clear Dashboard: Charts and tables summarizing key valuation results.
Disclaimer
All information, articles, and product details provided on this website are for general informational and educational purposes only. We do not claim any ownership over, nor do we intend to infringe upon, any trademarks, copyrights, logos, brand names, or other intellectual property mentioned or depicted on this site. Such intellectual property remains the property of its respective owners, and any references here are made solely for identification or informational purposes, without implying any affiliation, endorsement, or partnership.
We make no representations or warranties, express or implied, regarding the accuracy, completeness, or suitability of any content or products presented. Nothing on this website should be construed as legal, tax, investment, financial, medical, or other professional advice. In addition, no part of this site—including articles or product references—constitutes a solicitation, recommendation, endorsement, advertisement, or offer to buy or sell any securities, franchises, or other financial instruments, particularly in jurisdictions where such activity would be unlawful.
All content is of a general nature and may not address the specific circumstances of any individual or entity. It is not a substitute for professional advice or services. Any actions you take based on the information provided here are strictly at your own risk. You accept full responsibility for any decisions or outcomes arising from your use of this website and agree to release us from any liability in connection with your use of, or reliance upon, the content or products found herein.