
|
Wilhelmina International, Inc. (WHLM) DCF -Bewertung |
Fully Editable: Tailor To Your Needs In Excel Or Sheets
Professional Design: Trusted, Industry-Standard Templates
Investor-Approved Valuation Models
MAC/PC Compatible, Fully Unlocked
No Expertise Is Needed; Easy To Follow
Wilhelmina International, Inc. (WHLM) Bundle
Vereinfachen Sie die Bewertung der Wilhelmina International, Inc. (WHLM) mit diesem anpassbaren DCF -Taschenrechner! Mit Real Wilhelmina International, Inc. (WHLM) Finanzdaten und einstellbaren Prognoseeingaben können Sie Szenarien testen und Wilhelmina International, Inc. (WHLM) in wenigen Minuten aufdecken.
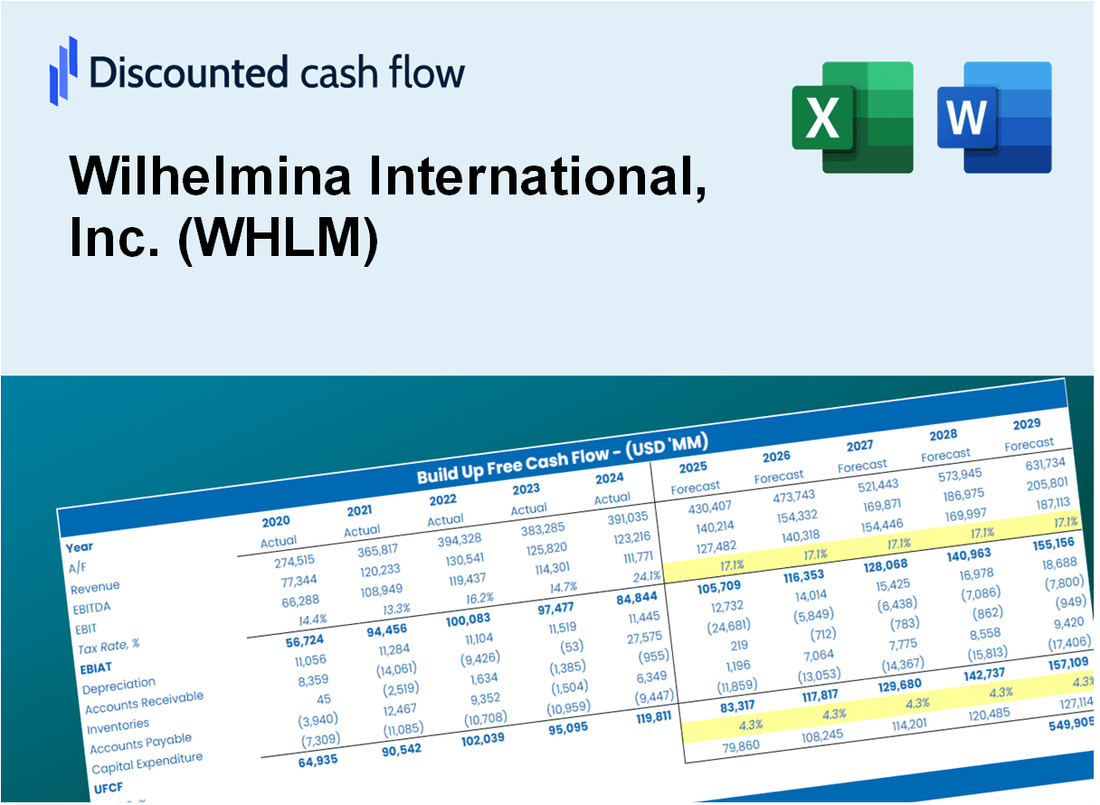
Discounted Cash Flow (DCF) - (USD MM)
| Year | AY1 2020 |
AY2 2021 |
AY3 2022 |
AY4 2023 |
AY5 2024 |
FY1 2025 |
FY2 2026 |
FY3 2027 |
FY4 2028 |
FY5 2029 |
|---|---|---|---|---|---|---|---|---|---|---|
| Revenue | 41.6 | 56.8 | 17.8 | 17.2 | 17.6 | 16.2 | 14.8 | 13.6 | 12.5 | 11.4 |
| Revenue Growth, % | 0 | 36.56 | -68.7 | -3.19 | 2.31 | -8.26 | -8.26 | -8.26 | -8.26 | -8.26 |
| EBITDA | -2.7 | 6.2 | 2.8 | .9 | 1.2 | 1.0 | 1.0 | .9 | .8 | .7 |
| EBITDA, % | -6.5 | 11 | 15.61 | 5.26 | 6.9 | 6.45 | 6.45 | 6.45 | 6.45 | 6.45 |
| Depreciation | 1.2 | .9 | .2 | .2 | .2 | .3 | .2 | .2 | .2 | .2 |
| Depreciation, % | 3 | 1.5 | 1.09 | 1.21 | 1.01 | 1.56 | 1.56 | 1.56 | 1.56 | 1.56 |
| EBIT | -4.0 | 5.4 | 2.6 | .7 | 1.0 | .8 | .7 | .7 | .6 | .6 |
| EBIT, % | -9.5 | 9.49 | 14.53 | 4.06 | 5.89 | 4.89 | 4.89 | 4.89 | 4.89 | 4.89 |
| Total Cash | 5.6 | 10.3 | 12.0 | 12.7 | 15.5 | 8.4 | 7.7 | 7.1 | 6.5 | 6.0 |
| Total Cash, percent | .0 | .0 | .0 | .0 | .0 | .0 | .0 | .0 | .0 | .0 |
| Account Receivables | 7.1 | 8.9 | 9.5 | 8.5 | 7.4 | 5.7 | 5.3 | 4.8 | 4.4 | 4.1 |
| Account Receivables, % | 17.18 | 15.59 | 53.25 | 49.41 | 41.95 | 35.48 | 35.48 | 35.48 | 35.48 | 35.48 |
| Inventories | .0 | .0 | .0 | .0 | .0 | .0 | .0 | .0 | .0 | .0 |
| Inventories, % | 0 | 0 | 0 | 0 | 0 | 0 | 0 | 0 | 0 | 0 |
| Accounts Payable | 2.9 | 3.8 | 4.3 | 3.9 | 4.8 | 2.8 | 2.6 | 2.4 | 2.2 | 2.0 |
| Accounts Payable, % | 6.89 | 6.62 | 24.22 | 22.9 | 27.35 | 17.6 | 17.6 | 17.6 | 17.6 | 17.6 |
| Capital Expenditure | -.2 | .0 | -.3 | -.2 | .0 | -.1 | -.1 | -.1 | -.1 | -.1 |
| Capital Expenditure, % | -0.37017 | -0.03344305 | -1.51 | -0.95863 | -0.14764 | -0.60344 | -0.60344 | -0.60344 | -0.60344 | -0.60344 |
| Tax Rate, % | 40.21 | 40.21 | 40.21 | 40.21 | 40.21 | 40.21 | 40.21 | 40.21 | 40.21 | 40.21 |
| EBITAT | -4.8 | 4.6 | 3.5 | .4 | .6 | .6 | .6 | .5 | .5 | .5 |
| Depreciation | ||||||||||
| Changes in Account Receivables | ||||||||||
| Changes in Inventories | ||||||||||
| Changes in Accounts Payable | ||||||||||
| Capital Expenditure | ||||||||||
| UFCF | -8.0 | 4.6 | 3.4 | 1.1 | 2.8 | .5 | 1.0 | .9 | .8 | .7 |
| WACC, % | 7.22 | 7.1 | 7.22 | 6.94 | 6.92 | 7.08 | 7.08 | 7.08 | 7.08 | 7.08 |
| PV UFCF | ||||||||||
| SUM PV UFCF | 3.2 | |||||||||
| Long Term Growth Rate, % | 0.50 | |||||||||
| Free cash flow (T + 1) | 1 | |||||||||
| Terminal Value | 11 | |||||||||
| Present Terminal Value | 8 | |||||||||
| Enterprise Value | 11 | |||||||||
| Net Debt | -5 | |||||||||
| Equity Value | 17 | |||||||||
| Diluted Shares Outstanding, MM | 5 | |||||||||
| Equity Value Per Share | 3.23 |
What You Will Receive
- Customizable Excel Template: A fully editable Excel-based DCF Calculator featuring pre-filled financial data for Wilhelmina International, Inc. (WHLM).
- Accurate Data: Access to historical performance metrics and future projections (highlighted in the designated cells).
- Adjustable Forecasts: Modify key assumptions such as revenue growth rates, EBITDA percentages, and WACC.
- Instant Calculations: Quickly evaluate how your inputs affect the valuation of Wilhelmina International, Inc. (WHLM).
- Professional Resource: Designed for investors, CFOs, consultants, and financial analysts.
- Intuitive Layout: Organized for simplicity and usability, complete with detailed instructions.
Key Features
- Comprehensive Data Access: Wilhelmina International’s historical performance metrics and projected forecasts.
- Customizable Parameters: Adjust inputs for WACC, tax rates, revenue growth, and profit margins.
- Real-Time Analytics: Observe Wilhelmina International’s intrinsic value update instantly.
- Intuitive Visualizations: Dashboard graphs illustrate valuation outcomes and essential indicators.
- Designed for Precision: A specialized tool tailored for analysts, investors, and finance professionals.
How It Works
- Step 1: Download the Excel file.
- Step 2: Review pre-entered Wilhelmina International data (historical and projected).
- Step 3: Adjust key assumptions (yellow cells) based on your analysis.
- Step 4: View automatic recalculations for Wilhelmina International’s intrinsic value.
- Step 5: Use the outputs for investment decisions or reporting.
Why Choose Wilhelmina International, Inc. (WHLM)?
- Save Time: Access a comprehensive platform without the hassle of starting from scratch.
- Enhance Accuracy: Utilize dependable industry data and metrics to minimize valuation errors.
- Completely Customizable: Adjust the tools to align with your specific insights and forecasts.
- User-Friendly: Intuitive visuals and outputs make it simple to interpret results.
- Endorsed by Professionals: Crafted for industry experts who prioritize accuracy and ease of use.
Who Should Use This Product?
- Individual Investors: Gain insights to make informed decisions about investing in Wilhelmina International, Inc. (WHLM).
- Financial Analysts: Enhance valuation processes with comprehensive financial models tailored for Wilhelmina International, Inc. (WHLM).
- Consultants: Provide clients with accurate valuation insights specific to Wilhelmina International, Inc. (WHLM) efficiently.
- Business Owners: Learn about the valuation methods of companies like Wilhelmina International, Inc. (WHLM) to inform your own business strategies.
- Finance Students: Explore real-world valuation techniques using data and scenarios related to Wilhelmina International, Inc. (WHLM).
What the Template Contains
- Preloaded WHLM Data: Historical and projected financial data, including revenue, EBIT, and capital expenditures.
- DCF and WACC Models: Professional-grade sheets for calculating intrinsic value and Weighted Average Cost of Capital.
- Editable Inputs: Yellow-highlighted cells for adjusting revenue growth, tax rates, and discount rates.
- Financial Statements: Comprehensive annual and quarterly financials for deeper analysis.
- Key Ratios: Profitability, leverage, and efficiency ratios to evaluate performance.
- Dashboard and Charts: Visual summaries of valuation outcomes and assumptions.
Disclaimer
All information, articles, and product details provided on this website are for general informational and educational purposes only. We do not claim any ownership over, nor do we intend to infringe upon, any trademarks, copyrights, logos, brand names, or other intellectual property mentioned or depicted on this site. Such intellectual property remains the property of its respective owners, and any references here are made solely for identification or informational purposes, without implying any affiliation, endorsement, or partnership.
We make no representations or warranties, express or implied, regarding the accuracy, completeness, or suitability of any content or products presented. Nothing on this website should be construed as legal, tax, investment, financial, medical, or other professional advice. In addition, no part of this site—including articles or product references—constitutes a solicitation, recommendation, endorsement, advertisement, or offer to buy or sell any securities, franchises, or other financial instruments, particularly in jurisdictions where such activity would be unlawful.
All content is of a general nature and may not address the specific circumstances of any individual or entity. It is not a substitute for professional advice or services. Any actions you take based on the information provided here are strictly at your own risk. You accept full responsibility for any decisions or outcomes arising from your use of this website and agree to release us from any liability in connection with your use of, or reliance upon, the content or products found herein.