
|
WingStop Inc. (Wing) DCF -Bewertung |
Fully Editable: Tailor To Your Needs In Excel Or Sheets
Professional Design: Trusted, Industry-Standard Templates
Investor-Approved Valuation Models
MAC/PC Compatible, Fully Unlocked
No Expertise Is Needed; Easy To Follow
Wingstop Inc. (WING) Bundle
Entdecken Sie die finanziellen Aussichten von Wingstop Inc. (WING) mit unserem benutzerfreundlichen DCF-Taschenrechner! Geben Sie Ihre Annahmen in Bezug auf Wachstum, Margen und Ausgaben ein, um den inneren Wert von WingStop Inc. (Wing) zu berechnen und Ihre Anlagestrategie zu verfeinern.
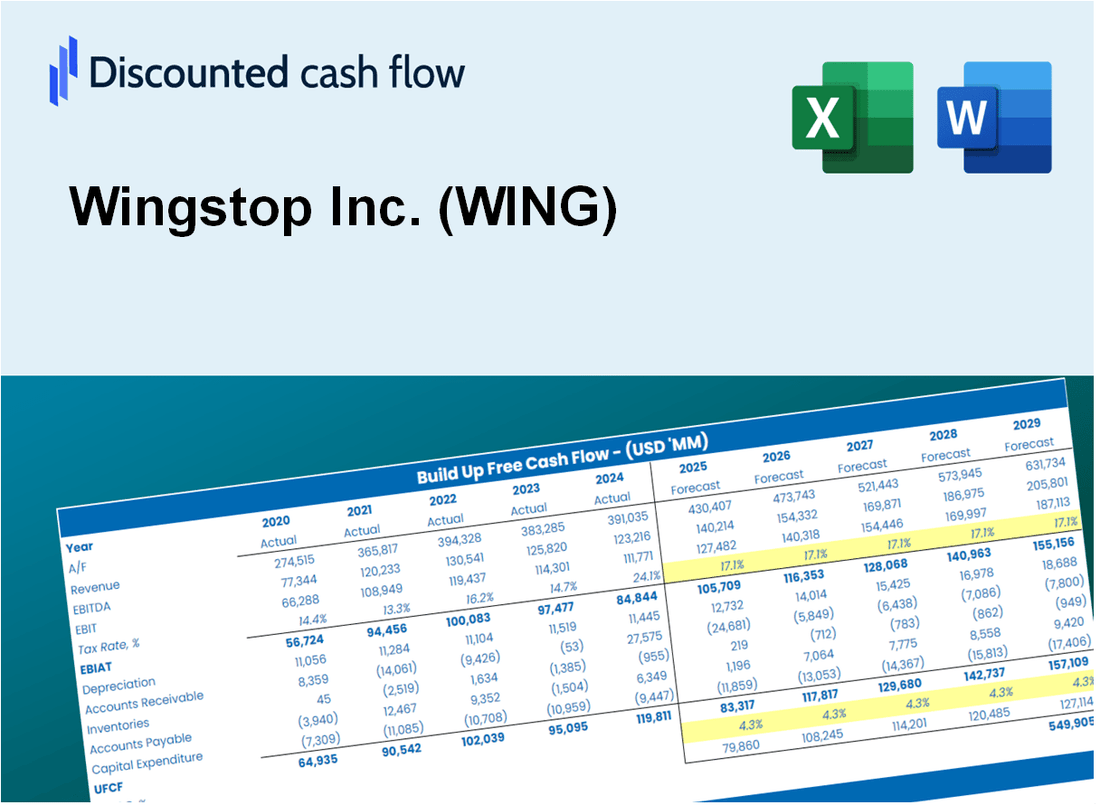
Discounted Cash Flow (DCF) - (USD MM)
| Year | AY1 2020 |
AY2 2021 |
AY3 2022 |
AY4 2023 |
AY5 2024 |
FY1 2025 |
FY2 2026 |
FY3 2027 |
FY4 2028 |
FY5 2029 |
|---|---|---|---|---|---|---|---|---|---|---|
| Revenue | 248.8 | 282.5 | 357.5 | 460.1 | 625.8 | 789.8 | 996.7 | 1,257.8 | 1,587.4 | 2,003.3 |
| Revenue Growth, % | 0 | 13.54 | 26.56 | 28.68 | 36.03 | 26.2 | 26.2 | 26.2 | 26.2 | 26.2 |
| EBITDA | 51.2 | 81.8 | 101.4 | 125.8 | 188.0 | 213.7 | 269.7 | 340.4 | 429.6 | 542.2 |
| EBITDA, % | 20.6 | 28.97 | 28.37 | 27.34 | 30.04 | 27.06 | 27.06 | 27.06 | 27.06 | 27.06 |
| Depreciation | 7.5 | 7.9 | 10.9 | 13.2 | 19.5 | 23.5 | 29.6 | 37.4 | 47.2 | 59.6 |
| Depreciation, % | 3.02 | 2.81 | 3.05 | 2.88 | 3.11 | 2.97 | 2.97 | 2.97 | 2.97 | 2.97 |
| EBIT | 43.7 | 73.9 | 90.5 | 112.5 | 168.5 | 190.2 | 240.1 | 303.0 | 382.4 | 482.6 |
| EBIT, % | 17.57 | 26.16 | 25.33 | 24.46 | 26.92 | 24.09 | 24.09 | 24.09 | 24.09 | 24.09 |
| Total Cash | 40.9 | 48.6 | 184.5 | 90.2 | 315.9 | 245.3 | 309.6 | 390.7 | 493.1 | 622.3 |
| Total Cash, percent | .0 | .0 | .0 | .0 | .0 | .0 | .0 | .0 | .0 | .0 |
| Account Receivables | 8.5 | 8.1 | 9.5 | 12.4 | 19.7 | 23.4 | 29.5 | 37.2 | 46.9 | 59.2 |
| Account Receivables, % | 3.43 | 2.87 | 2.65 | 2.7 | 3.14 | 2.96 | 2.96 | 2.96 | 2.96 | 2.96 |
| Inventories | .4 | .5 | .4 | .5 | .0 | .9 | 1.1 | 1.4 | 1.8 | 2.2 |
| Inventories, % | 0.15916 | 0.17133 | 0.1088 | 0.11629 | 0 | 0.11112 | 0.11112 | 0.11112 | 0.11112 | 0.11112 |
| Accounts Payable | 3.7 | 5.4 | 5.2 | 4.7 | 6.9 | 11.0 | 13.9 | 17.6 | 22.2 | 28.0 |
| Accounts Payable, % | 1.47 | 1.92 | 1.46 | 1.03 | 1.11 | 1.4 | 1.4 | 1.4 | 1.4 | 1.4 |
| Capital Expenditure | -6.1 | -28.0 | -23.9 | -40.8 | -51.9 | -57.2 | -72.2 | -91.1 | -115.0 | -145.1 |
| Capital Expenditure, % | -2.43 | -9.92 | -6.7 | -8.88 | -8.3 | -7.24 | -7.24 | -7.24 | -7.24 | -7.24 |
| Tax Rate, % | 26.14 | 26.14 | 26.14 | 26.14 | 26.14 | 26.14 | 26.14 | 26.14 | 26.14 | 26.14 |
| EBITAT | 37.8 | 53.5 | 69.2 | 83.7 | 124.4 | 145.9 | 184.2 | 232.4 | 293.3 | 370.2 |
| Depreciation | ||||||||||
| Changes in Account Receivables | ||||||||||
| Changes in Inventories | ||||||||||
| Changes in Accounts Payable | ||||||||||
| Capital Expenditure | ||||||||||
| UFCF | 34.0 | 35.5 | 54.7 | 52.6 | 87.5 | 111.7 | 138.2 | 174.4 | 220.1 | 277.7 |
| WACC, % | 10.63 | 10.56 | 10.58 | 10.57 | 10.56 | 10.58 | 10.58 | 10.58 | 10.58 | 10.58 |
| PV UFCF | ||||||||||
| SUM PV UFCF | 658.1 | |||||||||
| Long Term Growth Rate, % | 4.00 | |||||||||
| Free cash flow (T + 1) | 289 | |||||||||
| Terminal Value | 4,389 | |||||||||
| Present Terminal Value | 2,655 | |||||||||
| Enterprise Value | 3,313 | |||||||||
| Net Debt | 950 | |||||||||
| Equity Value | 2,363 | |||||||||
| Diluted Shares Outstanding, MM | 29 | |||||||||
| Equity Value Per Share | 80.43 |
What You Will Get
- Real WING Financials: Access to historical and projected data for precise valuation.
- Customizable Inputs: Adjust WACC, tax rates, revenue growth, and capital expenditures as needed.
- Dynamic Calculations: Intrinsic value and NPV are computed automatically.
- Scenario Analysis: Explore various scenarios to assess Wingstop’s future performance.
- User-Friendly Design: Designed for professionals while remaining approachable for newcomers.
Key Features
- Authentic Wingstop Financials: Gain access to reliable pre-loaded historical data and future projections for Wingstop Inc.
- Customizable Forecast Assumptions: Modify highlighted cells such as WACC, growth rates, and profit margins to fit your analysis.
- Dynamic Calculations: Enjoy automatic updates to DCF, Net Present Value (NPV), and cash flow assessments.
- Visual Dashboard: Utilize user-friendly charts and summaries to effectively visualize your valuation outcomes.
- For Professionals and Beginners: Designed with a straightforward structure for investors, CFOs, and consultants alike.
How It Works
- Download the Template: Gain immediate access to the Excel-based WING DCF Calculator.
- Input Your Assumptions: Modify the yellow-highlighted cells for growth rates, WACC, margins, and other factors.
- Instant Calculations: The model automatically recalculates Wingstop’s intrinsic value.
- Test Scenarios: Experiment with various assumptions to assess potential valuation impacts.
- Analyze and Decide: Utilize the outcomes to inform your investment or financial decisions.
Why Choose This Calculator for Wingstop Inc. (WING)?
- Comprehensive Tool: Integrates DCF, WACC, and financial ratio analyses tailored for Wingstop.
- Customizable Inputs: Modify yellow-highlighted cells to explore different financial scenarios.
- Detailed Insights: Automatically computes Wingstop’s intrinsic value and Net Present Value.
- Preloaded Data: Historical and projected data provide reliable starting points for analysis.
- Professional Quality: Perfect for financial analysts, investors, and business consultants focused on the restaurant industry.
Who Should Use Wingstop Inc. (WING)?
- Franchisees: Leverage a proven business model to successfully operate a Wingstop location.
- Investors: Analyze growth potential with detailed financial insights specific to Wingstop Inc. (WING).
- Food Industry Analysts: Assess market trends and performance metrics within the fast-casual dining sector.
- Marketing Professionals: Explore innovative strategies to enhance brand visibility and customer engagement.
- Students and Educators: Utilize Wingstop Inc. (WING) as a case study for business and marketing courses.
What the Template Contains
- Preloaded WING Data: Historical and projected financial data, including revenue, EBIT, and capital expenditures.
- DCF and WACC Models: Professional-grade sheets for calculating intrinsic value and Weighted Average Cost of Capital.
- Editable Inputs: Yellow-highlighted cells for adjusting revenue growth, tax rates, and discount rates.
- Financial Statements: Comprehensive annual and quarterly financials for deeper analysis.
- Key Ratios: Profitability, leverage, and efficiency ratios to evaluate performance.
- Dashboard and Charts: Visual summaries of valuation outcomes and assumptions.
Disclaimer
All information, articles, and product details provided on this website are for general informational and educational purposes only. We do not claim any ownership over, nor do we intend to infringe upon, any trademarks, copyrights, logos, brand names, or other intellectual property mentioned or depicted on this site. Such intellectual property remains the property of its respective owners, and any references here are made solely for identification or informational purposes, without implying any affiliation, endorsement, or partnership.
We make no representations or warranties, express or implied, regarding the accuracy, completeness, or suitability of any content or products presented. Nothing on this website should be construed as legal, tax, investment, financial, medical, or other professional advice. In addition, no part of this site—including articles or product references—constitutes a solicitation, recommendation, endorsement, advertisement, or offer to buy or sell any securities, franchises, or other financial instruments, particularly in jurisdictions where such activity would be unlawful.
All content is of a general nature and may not address the specific circumstances of any individual or entity. It is not a substitute for professional advice or services. Any actions you take based on the information provided here are strictly at your own risk. You accept full responsibility for any decisions or outcomes arising from your use of this website and agree to release us from any liability in connection with your use of, or reliance upon, the content or products found herein.