
|
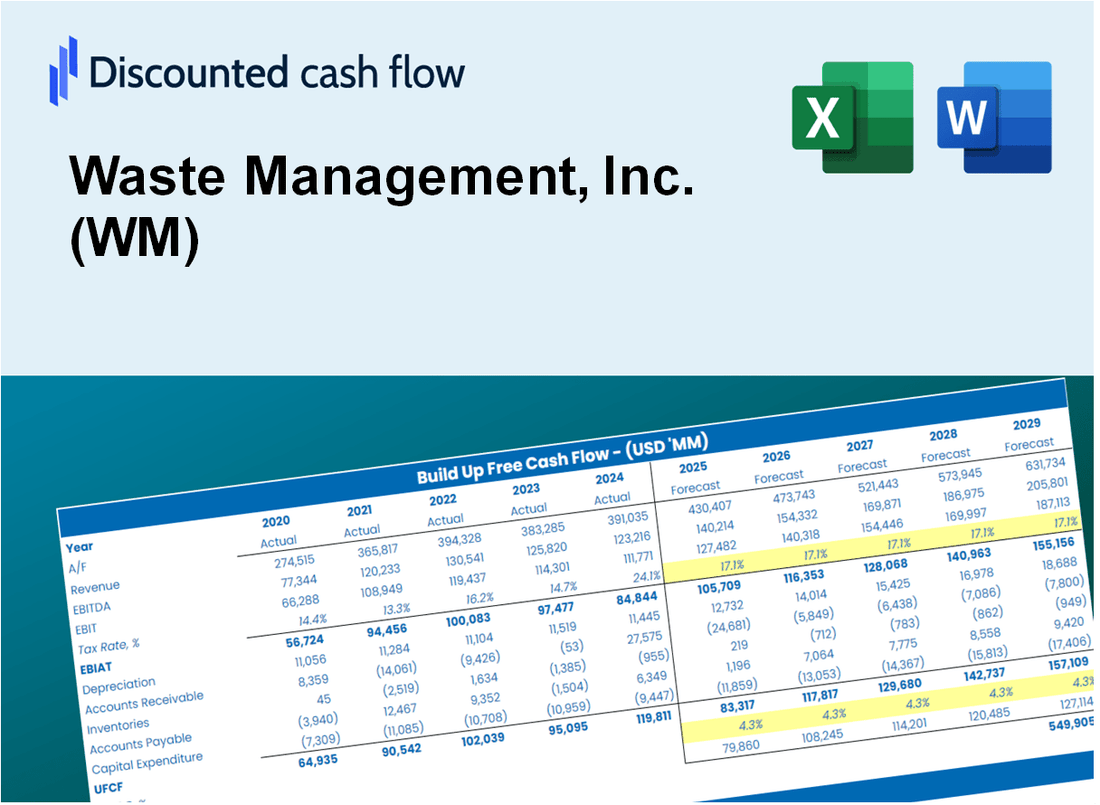
Abfallmanagement, Inc. (WM) DCF -Bewertung |
Fully Editable: Tailor To Your Needs In Excel Or Sheets
Professional Design: Trusted, Industry-Standard Templates
Investor-Approved Valuation Models
MAC/PC Compatible, Fully Unlocked
No Expertise Is Needed; Easy To Follow
Waste Management, Inc. (WM) Bundle
Verbessern Sie Ihre Anlagestrategie mit dem DCF -Taschenrechner von Waste Management, Inc. (WM)! Verwenden Sie reale Finanzdaten aus Abfallmanagement, passen Sie Wachstumsprojektionen und -kosten an und beobachten Sie sofort, wie sich diese Modifikationen auf den inneren Wert von WM auswirken.
What You Will Get
- Pre-Filled Financial Model: Waste Management, Inc.’s (WM) actual data provides accurate DCF valuation.
- Full Forecast Control: Modify revenue growth, profit margins, WACC, and other essential drivers.
- Instant Calculations: Automatic updates ensure you see immediate results as you adjust inputs.
- Investor-Ready Template: A polished Excel file crafted for high-quality valuation.
- Customizable and Reusable: Designed for adaptability, allowing for repeated use in comprehensive forecasts.
Key Features
- Comprehensive WM Data: Pre-loaded with Waste Management, Inc.'s historical performance metrics and future projections.
- Fully Customizable Inputs: Tailor revenue growth, operating margins, WACC, tax rates, and capital expenditures to suit your analysis.
- Dynamic Valuation Model: Real-time adjustments to Net Present Value (NPV) and intrinsic value based on your specified parameters.
- Scenario Analysis: Develop various forecasting scenarios to evaluate different valuation possibilities.
- User-Friendly Interface: Intuitive layout designed for both experienced professionals and newcomers.
How It Works
- Step 1: Download the Excel file.
- Step 2: Review Waste Management, Inc.'s (WM) pre-filled financial data and forecasts.
- Step 3: Modify critical inputs such as revenue growth, WACC, and tax rates (highlighted cells).
- Step 4: Observe the DCF model update in real-time as you adjust your assumptions.
- Step 5: Analyze the outputs and leverage the results for your investment decisions.
Why Choose Waste Management, Inc. (WM)?
- Streamlined Processes: Benefit from efficient waste management solutions tailored to your needs.
- Enhanced Sustainability: Our services promote environmentally responsible practices and waste reduction.
- Comprehensive Services: From collection to recycling, we offer a full range of waste management options.
- User-Friendly Interface: Access our services easily through our intuitive online platform.
- Industry Leader: Trusted by communities and businesses for reliable and effective waste solutions.
Who Should Use This Product?
- Investors: Accurately assess Waste Management, Inc.’s (WM) fair value prior to making investment choices.
- CFOs: Utilize a professional-grade DCF model for financial reporting and analysis specific to Waste Management, Inc. (WM).
- Consultants: Efficiently customize the template for valuation reports tailored to Waste Management, Inc. (WM) clients.
- Entrepreneurs: Acquire insights into financial modeling practices employed by leading waste management firms.
- Educators: Employ it as a teaching resource to illustrate valuation techniques relevant to Waste Management, Inc. (WM).
What the Template Contains
- Comprehensive DCF Model: Editable template with detailed valuation calculations tailored for Waste Management, Inc. (WM).
- Real-World Data: Waste Management’s historical and projected financials preloaded for analysis.
- Customizable Parameters: Adjust WACC, growth rates, and tax assumptions to explore different scenarios.
- Financial Statements: Complete annual and quarterly breakdowns for enhanced insights.
- Key Ratios: Integrated analysis for profitability, efficiency, and leverage metrics.
- Dashboard with Visual Outputs: Charts and tables designed for clear, actionable results.
Disclaimer
All information, articles, and product details provided on this website are for general informational and educational purposes only. We do not claim any ownership over, nor do we intend to infringe upon, any trademarks, copyrights, logos, brand names, or other intellectual property mentioned or depicted on this site. Such intellectual property remains the property of its respective owners, and any references here are made solely for identification or informational purposes, without implying any affiliation, endorsement, or partnership.
We make no representations or warranties, express or implied, regarding the accuracy, completeness, or suitability of any content or products presented. Nothing on this website should be construed as legal, tax, investment, financial, medical, or other professional advice. In addition, no part of this site—including articles or product references—constitutes a solicitation, recommendation, endorsement, advertisement, or offer to buy or sell any securities, franchises, or other financial instruments, particularly in jurisdictions where such activity would be unlawful.
All content is of a general nature and may not address the specific circumstances of any individual or entity. It is not a substitute for professional advice or services. Any actions you take based on the information provided here are strictly at your own risk. You accept full responsibility for any decisions or outcomes arising from your use of this website and agree to release us from any liability in connection with your use of, or reliance upon, the content or products found herein.