
|
Wrap Technologies, Inc. (Wrap) DCF -Bewertung |
Fully Editable: Tailor To Your Needs In Excel Or Sheets
Professional Design: Trusted, Industry-Standard Templates
Investor-Approved Valuation Models
MAC/PC Compatible, Fully Unlocked
No Expertise Is Needed; Easy To Follow
Wrap Technologies, Inc. (WRAP) Bundle
Gewinnen Sie Einblicke in Ihre Wrap Technologies, Inc. (Wrap) Bewertungsanalyse mit unserem DCF-Taschenrechner des hochmodernen DCF! Mit authentischen (Wrap-) Daten vorinstalliert, ermöglicht diese Excel -Vorlage, Prognosen und Annahmen anzupassen, um den inneren Wert von Wrap Technologies, Inc. genau zu bestimmen.
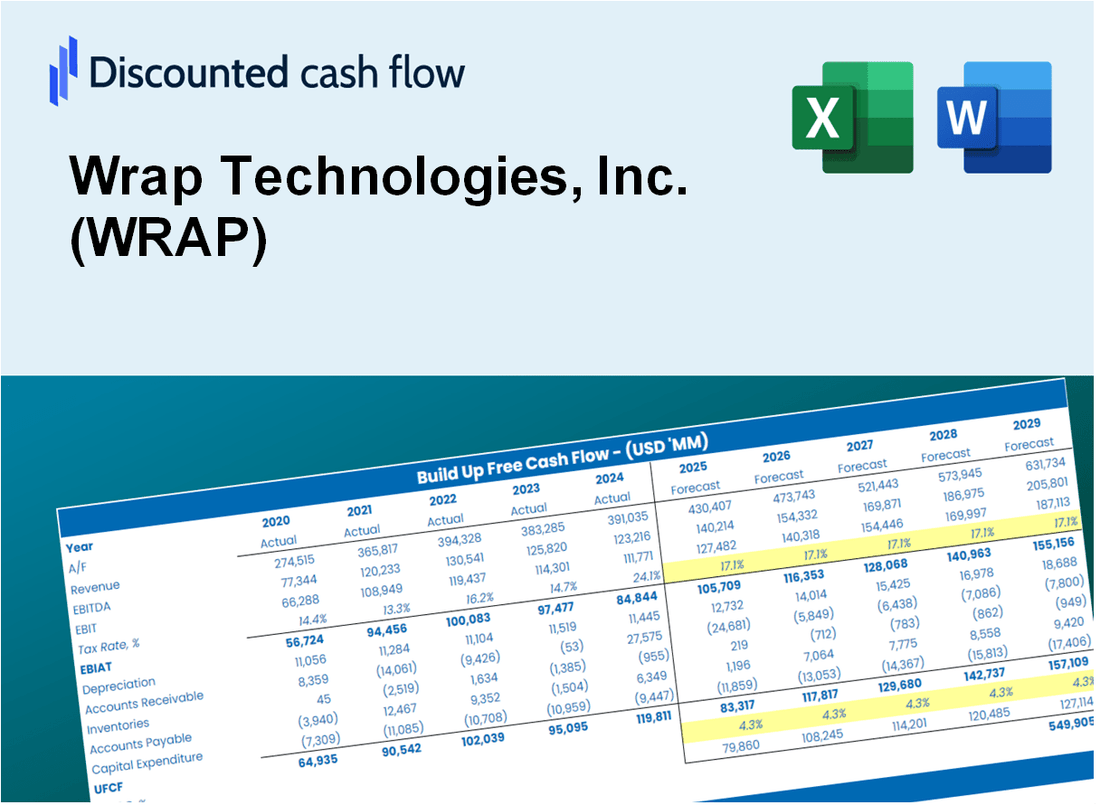
Discounted Cash Flow (DCF) - (USD MM)
| Year | AY1 2020 |
AY2 2021 |
AY3 2022 |
AY4 2023 |
AY5 2024 |
FY1 2025 |
FY2 2026 |
FY3 2027 |
FY4 2028 |
FY5 2029 |
|---|---|---|---|---|---|---|---|---|---|---|
| Revenue | 3.9 | 7.7 | 8.0 | 6.1 | 4.5 | 5.1 | 5.7 | 6.4 | 7.2 | 8.1 |
| Revenue Growth, % | 0 | 95.97 | 4.14 | -23.8 | -26.51 | 12.45 | 12.45 | 12.45 | 12.45 | 12.45 |
| EBITDA | -12.9 | -23.3 | -17.0 | -17.9 | -14.7 | -5.1 | -5.7 | -6.4 | -7.2 | -8.1 |
| EBITDA, % | -327.43 | -301.07 | -210.81 | -291.85 | -327.05 | -100 | -100 | -100 | -100 | -100 |
| Depreciation | .2 | .5 | .9 | .8 | .8 | .5 | .6 | .7 | .8 | .9 |
| Depreciation, % | 4.13 | 6.18 | 10.72 | 13.42 | 18.35 | 10.56 | 10.56 | 10.56 | 10.56 | 10.56 |
| EBIT | -13.1 | -23.7 | -17.8 | -18.7 | -15.6 | -5.1 | -5.7 | -6.4 | -7.2 | -8.1 |
| EBIT, % | -331.57 | -307.26 | -221.53 | -305.27 | -345.4 | -100 | -100 | -100 | -100 | -100 |
| Total Cash | 41.6 | 34.9 | 19.3 | 11.5 | 3.6 | 4.9 | 5.5 | 6.2 | 6.9 | 7.8 |
| Total Cash, percent | .0 | .0 | .0 | .0 | .0 | .0 | .0 | .0 | .0 | .0 |
| Account Receivables | 1.9 | 3.9 | 2.8 | 3.0 | .5 | 2.0 | 2.2 | 2.5 | 2.8 | 3.1 |
| Account Receivables, % | 47.44 | 49.93 | 35.16 | 49.32 | 11.38 | 38.65 | 38.65 | 38.65 | 38.65 | 38.65 |
| Inventories | 2.7 | 1.6 | 4.0 | 5.8 | 6.2 | 3.4 | 3.8 | 4.2 | 4.8 | 5.4 |
| Inventories, % | 67.32 | 20.26 | 49.39 | 94.47 | 136.9 | 66.29 | 66.29 | 66.29 | 66.29 | 66.29 |
| Accounts Payable | 1.2 | 1.8 | 1.4 | 1.1 | .6 | 1.0 | 1.2 | 1.3 | 1.5 | 1.7 |
| Accounts Payable, % | 31.24 | 23.02 | 17.63 | 18.1 | 13.51 | 20.7 | 20.7 | 20.7 | 20.7 | 20.7 |
| Capital Expenditure | -.9 | -1.0 | -.3 | -.2 | .0 | -.4 | -.5 | -.6 | -.6 | -.7 |
| Capital Expenditure, % | -23.35 | -12.87 | -3.18 | -3.75 | -0.26625 | -8.68 | -8.68 | -8.68 | -8.68 | -8.68 |
| Tax Rate, % | 17.17 | 17.17 | 17.17 | 17.17 | 17.17 | 17.17 | 17.17 | 17.17 | 17.17 | 17.17 |
| EBITAT | -13.1 | -23.7 | -17.6 | -18.7 | -12.9 | -4.9 | -5.5 | -6.2 | -6.9 | -7.8 |
| Depreciation | ||||||||||
| Changes in Account Receivables | ||||||||||
| Changes in Inventories | ||||||||||
| Changes in Accounts Payable | ||||||||||
| Capital Expenditure | ||||||||||
| UFCF | -17.1 | -24.6 | -18.7 | -20.5 | -10.4 | -3.0 | -5.9 | -6.6 | -7.5 | -8.4 |
| WACC, % | 10.09 | 10.09 | 10.09 | 10.09 | 10.08 | 10.09 | 10.09 | 10.09 | 10.09 | 10.09 |
| PV UFCF | ||||||||||
| SUM PV UFCF | -22.9 | |||||||||
| Long Term Growth Rate, % | 2.00 | |||||||||
| Free cash flow (T + 1) | -9 | |||||||||
| Terminal Value | -106 | |||||||||
| Present Terminal Value | -66 | |||||||||
| Enterprise Value | -88 | |||||||||
| Net Debt | -1 | |||||||||
| Equity Value | -87 | |||||||||
| Diluted Shares Outstanding, MM | 46 | |||||||||
| Equity Value Per Share | -1.91 |
What You Will Get
- Editable Forecast Inputs: Easily modify assumptions (growth %, margins, WACC) to explore various scenarios.
- Real-World Data: Wrap Technologies, Inc.'s (WRAP) financial data pre-filled to kickstart your analysis.
- Automatic DCF Outputs: The template automatically calculates Net Present Value (NPV) and intrinsic value for you.
- Customizable and Professional: A refined Excel model that adjusts to your valuation requirements.
- Built for Analysts and Investors: Perfect for testing projections, validating strategies, and enhancing efficiency.
Key Features
- Customizable Financial Inputs: Adjust essential metrics such as revenue projections, profit margins, and investment expenses.
- Instant DCF Valuation: Provides immediate calculations for intrinsic value, net present value (NPV), and additional financial metrics.
- High Precision Results: Leverages Wrap Technologies' actual financial data for accurate valuation analyses.
- Effortless Scenario Testing: Easily explore various assumptions and evaluate their impacts on outcomes.
- Efficiency Booster: Streamlines the valuation process, removing the necessity to create intricate models from the ground up.
How It Works
- Step 1: Download the prebuilt Excel template featuring Wrap Technologies, Inc. (WRAP) data.
- Step 2: Navigate through the pre-filled sheets to grasp the essential metrics.
- Step 3: Modify forecasts and assumptions in the editable yellow cells (WACC, growth, margins).
- Step 4: Immediately view updated results, including Wrap Technologies' intrinsic value.
- Step 5: Make informed investment choices or create reports based on the outputs.
Why Choose This Calculator for Wrap Technologies, Inc. (WRAP)?
- Accurate Data: Utilize real financials from Wrap Technologies for trustworthy valuation outcomes.
- Customizable: Modify essential parameters such as growth rates, WACC, and tax rates to align with your forecasts.
- Time-Saving: Built-in calculations save you the effort of starting from the ground up.
- Professional-Grade Tool: Tailored for investors, analysts, and consultants focusing on WRAP.
- User-Friendly: Easy-to-navigate design and clear instructions ensure accessibility for all users.
Who Should Use This Product?
- Investors: Evaluate Wrap Technologies’ valuation before making investment decisions.
- CFOs and Financial Analysts: Optimize valuation workflows and assess financial forecasts.
- Startup Founders: Gain insights into how companies like Wrap Technologies are valued in the market.
- Consultants: Provide detailed valuation analyses and reports for clients in the tech sector.
- Students and Educators: Utilize current market data to learn and teach valuation methodologies.
What the Template Contains
- Pre-Filled Data: Includes Wrap Technologies, Inc.'s historical financials and forecasts.
- Discounted Cash Flow Model: Editable DCF valuation model with automatic calculations.
- Weighted Average Cost of Capital (WACC): A dedicated sheet for calculating WACC based on custom inputs.
- Key Financial Ratios: Analyze Wrap Technologies, Inc.'s profitability, efficiency, and leverage.
- Customizable Inputs: Edit revenue growth, margins, and tax rates with ease.
- Clear Dashboard: Charts and tables summarizing key valuation results.
Disclaimer
All information, articles, and product details provided on this website are for general informational and educational purposes only. We do not claim any ownership over, nor do we intend to infringe upon, any trademarks, copyrights, logos, brand names, or other intellectual property mentioned or depicted on this site. Such intellectual property remains the property of its respective owners, and any references here are made solely for identification or informational purposes, without implying any affiliation, endorsement, or partnership.
We make no representations or warranties, express or implied, regarding the accuracy, completeness, or suitability of any content or products presented. Nothing on this website should be construed as legal, tax, investment, financial, medical, or other professional advice. In addition, no part of this site—including articles or product references—constitutes a solicitation, recommendation, endorsement, advertisement, or offer to buy or sell any securities, franchises, or other financial instruments, particularly in jurisdictions where such activity would be unlawful.
All content is of a general nature and may not address the specific circumstances of any individual or entity. It is not a substitute for professional advice or services. Any actions you take based on the information provided here are strictly at your own risk. You accept full responsibility for any decisions or outcomes arising from your use of this website and agree to release us from any liability in connection with your use of, or reliance upon, the content or products found herein.