
|
Wave Life Sciences Ltd. (WVE) DCF -Bewertung |
Fully Editable: Tailor To Your Needs In Excel Or Sheets
Professional Design: Trusted, Industry-Standard Templates
Investor-Approved Valuation Models
MAC/PC Compatible, Fully Unlocked
No Expertise Is Needed; Easy To Follow
Wave Life Sciences Ltd. (WVE) Bundle
Möchten Sie den inneren Wert von Wave Life Sciences Ltd. messen? Unser WVE DCF-Taschenrechner integriert reale Daten mit umfangreichen Anpassungsfunktionen, sodass Sie Ihre Prognosen anpassen und Ihre Investitionsauswahl verbessern können.
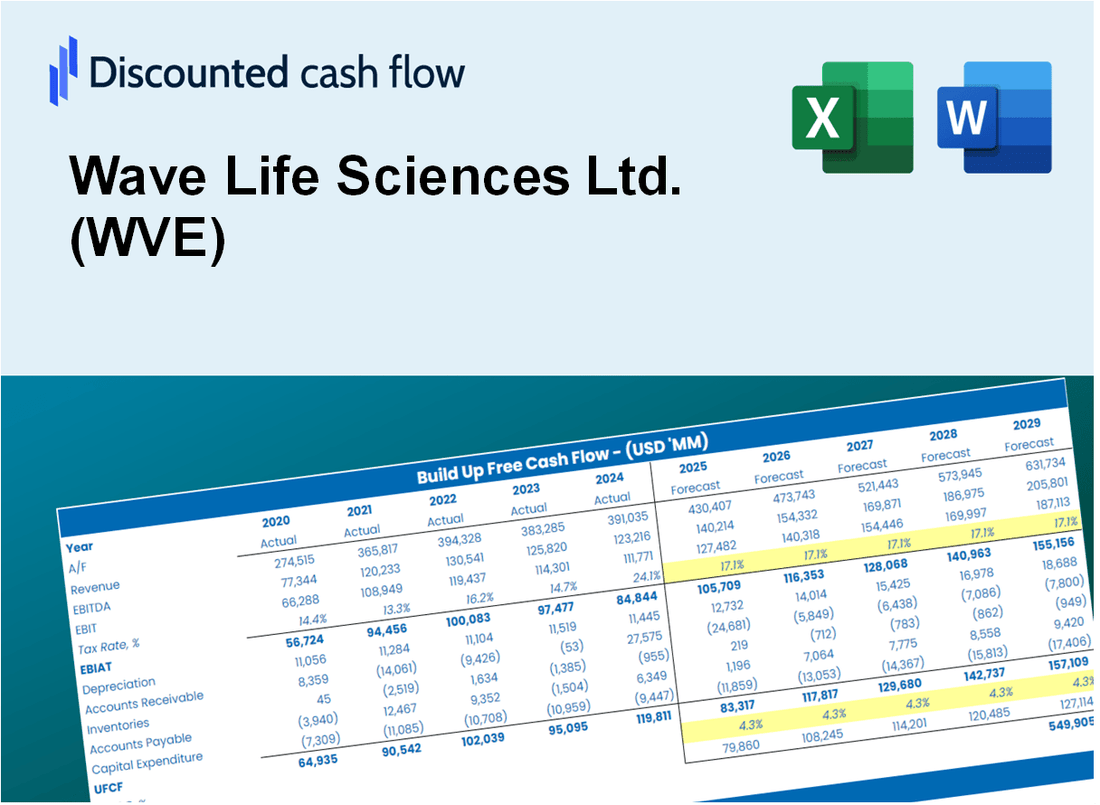
Discounted Cash Flow (DCF) - (USD MM)
| Year | AY1 2020 |
AY2 2021 |
AY3 2022 |
AY4 2023 |
AY5 2024 |
FY1 2025 |
FY2 2026 |
FY3 2027 |
FY4 2028 |
FY5 2029 |
|---|---|---|---|---|---|---|---|---|---|---|
| Revenue | 20.1 | 41.0 | 3.6 | 113.3 | 108.3 | 136.6 | 172.3 | 217.3 | 274.0 | 345.6 |
| Revenue Growth, % | 0 | 104.03 | -91.09 | 3005.1 | -4.42 | 26.12 | 26.12 | 26.12 | 26.12 | 26.12 |
| EBITDA | -143.4 | -117.2 | -152.6 | -58.8 | -101.7 | -121.8 | -153.6 | -193.7 | -244.3 | -308.2 |
| EBITDA, % | -714.22 | -286.06 | -4182.13 | -51.89 | -93.94 | -89.17 | -89.17 | -89.17 | -89.17 | -89.17 |
| Depreciation | 10.0 | 9.8 | 10.1 | 9.2 | 8.7 | 51.9 | 65.4 | 82.5 | 104.1 | 131.2 |
| Depreciation, % | 49.72 | 24.01 | 277.17 | 8.12 | 8 | 37.97 | 37.97 | 37.97 | 37.97 | 37.97 |
| EBIT | -153.4 | -127.0 | -162.7 | -68.0 | -110.4 | -125.7 | -158.5 | -199.9 | -252.1 | -318.0 |
| EBIT, % | -763.94 | -310.07 | -4459.3 | -60.01 | -101.94 | -92 | -92 | -92 | -92 | -92 |
| Total Cash | 184.5 | 150.6 | 88.5 | 200.4 | 302.1 | 136.6 | 172.3 | 217.3 | 274.0 | 345.6 |
| Total Cash, percent | .0 | .0 | .0 | .0 | .0 | .0 | .0 | .0 | .0 | .0 |
| Account Receivables | 30.0 | .0 | .0 | 21.1 | 1.4 | 32.8 | 41.3 | 52.1 | 65.7 | 82.9 |
| Account Receivables, % | 149.42 | 0 | 0 | 18.61 | 1.31 | 23.98 | 23.98 | 23.98 | 23.98 | 23.98 |
| Inventories | .0 | .0 | .0 | .0 | .0 | .0 | .0 | .0 | .0 | .0 |
| Inventories, % | 0 | 0 | 0 | 0 | 0 | 0 | 0 | 0 | 0 | 0 |
| Accounts Payable | 13.8 | 7.3 | 16.9 | 12.8 | 16.3 | 58.1 | 73.3 | 92.5 | 116.6 | 147.1 |
| Accounts Payable, % | 68.71 | 17.77 | 463.55 | 11.33 | 15.02 | 42.57 | 42.57 | 42.57 | 42.57 | 42.57 |
| Capital Expenditure | -1.3 | -.6 | -1.4 | -1.1 | -.9 | -12.9 | -16.3 | -20.5 | -25.9 | -32.6 |
| Capital Expenditure, % | -6.66 | -1.37 | -37.3 | -0.98407 | -0.8661 | -9.44 | -9.44 | -9.44 | -9.44 | -9.44 |
| Tax Rate, % | 0 | 0 | 0 | 0 | 0 | 0 | 0 | 0 | 0 | 0 |
| EBITAT | -152.5 | -126.8 | -163.4 | -67.2 | -110.4 | -125.2 | -157.9 | -199.1 | -251.2 | -316.8 |
| Depreciation | ||||||||||
| Changes in Account Receivables | ||||||||||
| Changes in Inventories | ||||||||||
| Changes in Accounts Payable | ||||||||||
| Capital Expenditure | ||||||||||
| UFCF | -160.1 | -94.0 | -145.0 | -84.3 | -79.6 | -75.7 | -102.1 | -128.8 | -162.4 | -204.9 |
| WACC, % | 4.66 | 4.66 | 4.66 | 4.66 | 4.66 | 4.66 | 4.66 | 4.66 | 4.66 | 4.66 |
| PV UFCF | ||||||||||
| SUM PV UFCF | -576.4 | |||||||||
| Long Term Growth Rate, % | 2.00 | |||||||||
| Free cash flow (T + 1) | -209 | |||||||||
| Terminal Value | -7,856 | |||||||||
| Present Terminal Value | -6,256 | |||||||||
| Enterprise Value | -6,833 | |||||||||
| Net Debt | -277 | |||||||||
| Equity Value | -6,556 | |||||||||
| Diluted Shares Outstanding, MM | 138 | |||||||||
| Equity Value Per Share | -47.41 |
What You Will Get
- Comprehensive WVE Financials: Access to historical and projected data for precise valuation.
- Customizable Inputs: Adjust WACC, tax rates, revenue growth, and capital expenditures to fit your analysis.
- Dynamic Calculations: Intrinsic value and NPV are computed in real-time.
- Scenario Analysis: Explore various scenarios to assess Wave Life Sciences' future performance.
- User-Friendly Design: Designed for industry experts while remaining approachable for newcomers.
Key Features
- Customizable Research Metrics: Adjust essential factors such as drug development timelines, market potential, and operational costs.
- Instant Valuation Insights: Provides real-time calculations of intrinsic value, NPV, and other key financial indicators.
- Industry-Leading Precision: Utilizes Wave Life Sciences Ltd.'s (WVE) actual financial data for accurate valuation results.
- Effortless Scenario Testing: Easily evaluate various hypotheses and analyze their potential impacts.
- Efficiency Booster: Streamline the valuation process without the hassle of constructing intricate models from the ground up.
How It Works
- Step 1: Download the Excel file.
- Step 2: Review pre-entered Wave Life Sciences data (historical and projected).
- Step 3: Adjust key assumptions (yellow cells) based on your analysis.
- Step 4: View automatic recalculations for Wave Life Sciences' intrinsic value.
- Step 5: Use the outputs for investment decisions or reporting.
Why Choose This Calculator for Wave Life Sciences Ltd. (WVE)?
- Designed for Experts: A sophisticated tool tailored for researchers, biopharmaceutical analysts, and investment professionals.
- Accurate Data: Wave Life Sciences’ historical and projected financials are preloaded for precision.
- Flexible Scenario Analysis: Effortlessly model various forecasts and assumptions.
- Insightful Outputs: Automatically computes intrinsic value, NPV, and essential performance metrics.
- User-Friendly: Comprehensive step-by-step guidance ensures a smooth experience.
Who Should Use This Product?
- Individual Investors: Make informed decisions about buying or selling Wave Life Sciences Ltd. (WVE) stock.
- Financial Analysts: Enhance valuation processes with comprehensive financial models tailored for Wave Life Sciences Ltd. (WVE).
- Consultants: Provide clients with expert valuation insights on Wave Life Sciences Ltd. (WVE) swiftly and accurately.
- Business Owners: Gain insights into how biopharmaceutical companies like Wave Life Sciences Ltd. (WVE) are valued to inform your own business strategy.
- Finance Students: Explore valuation techniques using real-world data and case studies focused on Wave Life Sciences Ltd. (WVE).
What the Template Contains
- Pre-Filled Data: Includes Wave Life Sciences Ltd.'s historical financials and projections.
- Discounted Cash Flow Model: Editable DCF valuation model with automated calculations.
- Weighted Average Cost of Capital (WACC): A dedicated sheet for calculating WACC based on user-defined inputs.
- Key Financial Ratios: Evaluate Wave Life Sciences Ltd.'s profitability, efficiency, and leverage.
- Customizable Inputs: Easily modify revenue growth, profit margins, and tax rates.
- Clear Dashboard: Visual representations and tables summarizing essential valuation outcomes.
Disclaimer
All information, articles, and product details provided on this website are for general informational and educational purposes only. We do not claim any ownership over, nor do we intend to infringe upon, any trademarks, copyrights, logos, brand names, or other intellectual property mentioned or depicted on this site. Such intellectual property remains the property of its respective owners, and any references here are made solely for identification or informational purposes, without implying any affiliation, endorsement, or partnership.
We make no representations or warranties, express or implied, regarding the accuracy, completeness, or suitability of any content or products presented. Nothing on this website should be construed as legal, tax, investment, financial, medical, or other professional advice. In addition, no part of this site—including articles or product references—constitutes a solicitation, recommendation, endorsement, advertisement, or offer to buy or sell any securities, franchises, or other financial instruments, particularly in jurisdictions where such activity would be unlawful.
All content is of a general nature and may not address the specific circumstances of any individual or entity. It is not a substitute for professional advice or services. Any actions you take based on the information provided here are strictly at your own risk. You accept full responsibility for any decisions or outcomes arising from your use of this website and agree to release us from any liability in connection with your use of, or reliance upon, the content or products found herein.