
|
Woodward, Inc. (WWD) DCF -Bewertung |
Fully Editable: Tailor To Your Needs In Excel Or Sheets
Professional Design: Trusted, Industry-Standard Templates
Investor-Approved Valuation Models
MAC/PC Compatible, Fully Unlocked
No Expertise Is Needed; Easy To Follow
Woodward, Inc. (WWD) Bundle
Entdecken Sie die finanzielle Zukunft von Woodward, Inc. (WWD) mit unserem benutzerfreundlichen DCF-Taschenrechner! Geben Sie Ihre Projektionen für Wachstum, Margen und Ausgaben ein, um den inneren Wert von Woodward, Inc. (WWD) zu bestimmen und Ihre Anlagestrategie zu verbessern.
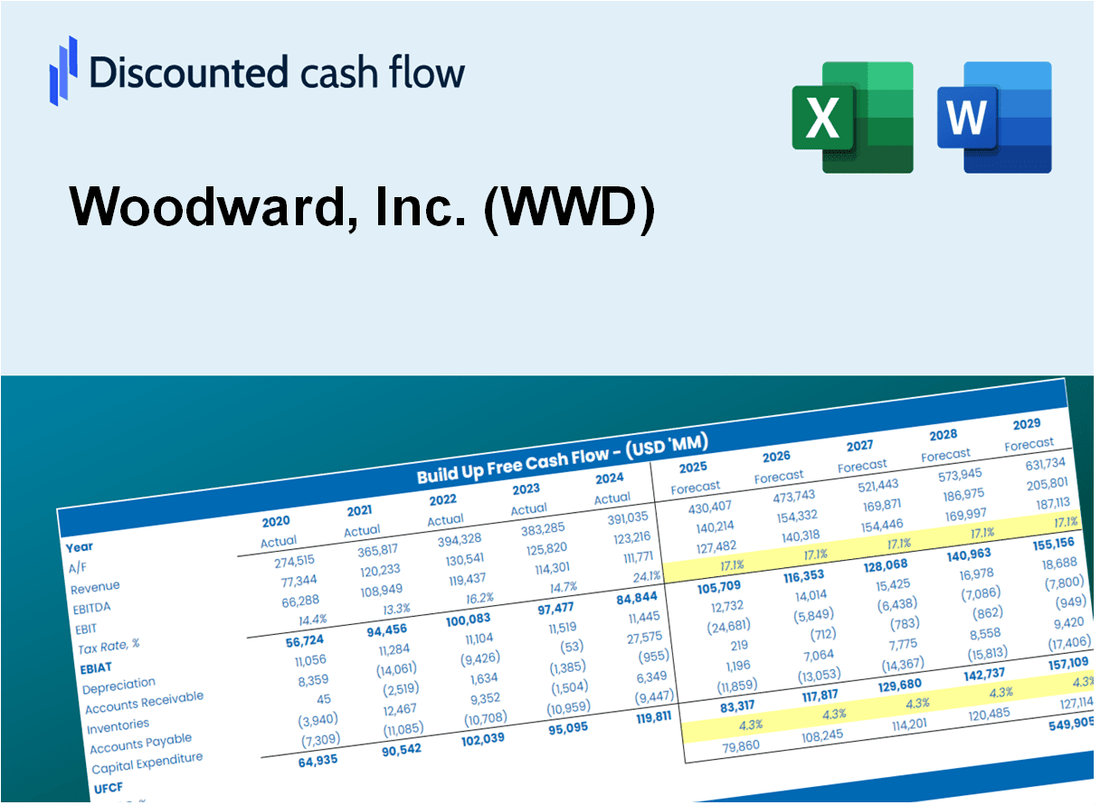
Discounted Cash Flow (DCF) - (USD MM)
| Year | AY1 2020 |
AY2 2021 |
AY3 2022 |
AY4 2023 |
AY5 2024 |
FY1 2025 |
FY2 2026 |
FY3 2027 |
FY4 2028 |
FY5 2029 |
|---|---|---|---|---|---|---|---|---|---|---|
| Revenue | 2,495.7 | 2,245.8 | 2,382.8 | 2,914.6 | 3,324.2 | 3,594.0 | 3,885.7 | 4,201.0 | 4,542.0 | 4,910.6 |
| Revenue Growth, % | 0 | -10.01 | 6.1 | 22.32 | 14.06 | 8.12 | 8.12 | 8.12 | 8.12 | 8.12 |
| EBITDA | 448.9 | 409.6 | 355.1 | 443.3 | 618.1 | 610.5 | 660.0 | 713.6 | 771.5 | 834.1 |
| EBITDA, % | 17.99 | 18.24 | 14.9 | 15.21 | 18.59 | 16.99 | 16.99 | 16.99 | 16.99 | 16.99 |
| Depreciation | 131.2 | 129.5 | 120.6 | 119.7 | 116.2 | 170.3 | 184.1 | 199.0 | 215.2 | 232.6 |
| Depreciation, % | 5.26 | 5.77 | 5.06 | 4.11 | 3.49 | 4.74 | 4.74 | 4.74 | 4.74 | 4.74 |
| EBIT | 317.7 | 280.1 | 234.4 | 323.6 | 501.9 | 440.2 | 475.9 | 514.6 | 556.3 | 601.5 |
| EBIT, % | 12.73 | 12.47 | 9.84 | 11.1 | 15.1 | 12.25 | 12.25 | 12.25 | 12.25 | 12.25 |
| Total Cash | 153.3 | 448.5 | 107.8 | 137.4 | 282.3 | 315.1 | 340.7 | 368.4 | 398.3 | 430.6 |
| Total Cash, percent | .0 | .0 | .0 | .0 | .0 | .0 | .0 | .0 | .0 | .0 |
| Account Receivables | 566.9 | 535.1 | 615.1 | 764.0 | 792.1 | 879.8 | 951.2 | 1,028.4 | 1,111.8 | 1,202.1 |
| Account Receivables, % | 22.71 | 23.83 | 25.82 | 26.21 | 23.83 | 24.48 | 24.48 | 24.48 | 24.48 | 24.48 |
| Inventories | 437.9 | 420.0 | 514.3 | 517.8 | 609.1 | 675.1 | 729.9 | 789.1 | 853.2 | 922.4 |
| Inventories, % | 17.55 | 18.7 | 21.58 | 17.77 | 18.32 | 18.78 | 18.78 | 18.78 | 18.78 | 18.78 |
| Accounts Payable | 134.2 | 170.9 | 230.5 | 234.3 | 287.5 | 282.9 | 305.8 | 330.6 | 357.5 | 386.5 |
| Accounts Payable, % | 5.38 | 7.61 | 9.67 | 8.04 | 8.65 | 7.87 | 7.87 | 7.87 | 7.87 | 7.87 |
| Capital Expenditure | -47.1 | -37.7 | -52.9 | -76.5 | -96.3 | -81.3 | -87.9 | -95.0 | -102.7 | -111.0 |
| Capital Expenditure, % | -1.89 | -1.68 | -2.22 | -2.62 | -2.9 | -2.26 | -2.26 | -2.26 | -2.26 | -2.26 |
| Tax Rate, % | 17.84 | 17.84 | 17.84 | 17.84 | 17.84 | 17.84 | 17.84 | 17.84 | 17.84 | 17.84 |
| EBITAT | 270.9 | 237.7 | 201.4 | 272.7 | 412.4 | 372.0 | 402.1 | 434.8 | 470.1 | 508.2 |
| Depreciation | ||||||||||
| Changes in Account Receivables | ||||||||||
| Changes in Inventories | ||||||||||
| Changes in Accounts Payable | ||||||||||
| Capital Expenditure | ||||||||||
| UFCF | -515.6 | 416.0 | 154.4 | 167.3 | 366.0 | 302.6 | 395.2 | 427.2 | 461.9 | 499.4 |
| WACC, % | 9.37 | 9.37 | 9.37 | 9.37 | 9.36 | 9.37 | 9.37 | 9.37 | 9.37 | 9.37 |
| PV UFCF | ||||||||||
| SUM PV UFCF | 1,575.6 | |||||||||
| Long Term Growth Rate, % | 4.00 | |||||||||
| Free cash flow (T + 1) | 519 | |||||||||
| Terminal Value | 9,676 | |||||||||
| Present Terminal Value | 6,184 | |||||||||
| Enterprise Value | 7,760 | |||||||||
| Net Debt | 613 | |||||||||
| Equity Value | 7,147 | |||||||||
| Diluted Shares Outstanding, MM | 62 | |||||||||
| Equity Value Per Share | 115.11 |
What You Will Get
- Real WWD Financials: Access to historical and projected data for precise valuation.
- Customizable Inputs: Adjust WACC, tax rates, revenue growth, and capital expenditures as needed.
- Dynamic Calculations: Intrinsic value and NPV are computed in real-time.
- Scenario Analysis: Evaluate various scenarios to assess Woodward’s future performance.
- User-Friendly Design: Designed for professionals while remaining approachable for newcomers.
Key Features
- Comprehensive Woodward Financials: Gain access to precise pre-loaded historical data and future forecasts.
- Adjustable Forecast Parameters: Modify highlighted cells for WACC, growth rates, and profit margins.
- Real-Time Calculations: Automatic updates for DCF, Net Present Value (NPV), and cash flow assessments.
- Interactive Dashboard: User-friendly charts and summaries to help you visualize your valuation outcomes.
- Suitable for All Skill Levels: A straightforward, intuitive layout designed for investors, CFOs, and consultants alike.
How It Works
- Step 1: Download the Excel file for Woodward, Inc. (WWD).
- Step 2: Review the pre-filled data for Woodward, Inc. (WWD) including historical and projected figures.
- Step 3: Modify the key assumptions (highlighted in yellow) based on your insights.
- Step 4: Observe the automatic recalculations reflecting Woodward, Inc.'s (WWD) intrinsic value.
- Step 5: Utilize the results for your investment strategies or financial reporting.
Why Choose Woodward, Inc. (WWD)?
- Time Efficiency: Quickly access comprehensive solutions without starting from scratch.
- Enhanced Accuracy: Dependable data and calculations minimize valuation discrepancies.
- Fully Adaptable: Customize the tools to align with your specific assumptions and forecasts.
- User-Friendly: Intuitive visuals and outputs simplify the analysis process.
- Endorsed by Professionals: Crafted for experts who prioritize precision and functionality.
Who Should Use Woodward, Inc. (WWD)?
- Engineering Students: Explore advanced engineering principles and apply them to real-world scenarios.
- Researchers: Utilize Woodward's technologies in your studies or academic projects.
- Manufacturers: Assess and enhance your production processes using insights from Woodward's innovations.
- Industry Analysts: Analyze market trends and evaluate Woodward's performance with comprehensive data tools.
- Business Leaders: Understand how leading companies like Woodward are shaping the future of their industries.
What the Template Contains
- Comprehensive DCF Model: Editable template featuring in-depth valuation calculations.
- Real-World Data: Woodward, Inc.'s (WWD) historical and projected financials preloaded for analysis.
- Customizable Parameters: Modify WACC, growth rates, and tax assumptions to explore various scenarios.
- Financial Statements: Complete annual and quarterly breakdowns for enhanced insights.
- Key Ratios: Integrated analysis for profitability, efficiency, and leverage metrics.
- Dashboard with Visual Outputs: Charts and tables providing clear, actionable results.
Disclaimer
All information, articles, and product details provided on this website are for general informational and educational purposes only. We do not claim any ownership over, nor do we intend to infringe upon, any trademarks, copyrights, logos, brand names, or other intellectual property mentioned or depicted on this site. Such intellectual property remains the property of its respective owners, and any references here are made solely for identification or informational purposes, without implying any affiliation, endorsement, or partnership.
We make no representations or warranties, express or implied, regarding the accuracy, completeness, or suitability of any content or products presented. Nothing on this website should be construed as legal, tax, investment, financial, medical, or other professional advice. In addition, no part of this site—including articles or product references—constitutes a solicitation, recommendation, endorsement, advertisement, or offer to buy or sell any securities, franchises, or other financial instruments, particularly in jurisdictions where such activity would be unlawful.
All content is of a general nature and may not address the specific circumstances of any individual or entity. It is not a substitute for professional advice or services. Any actions you take based on the information provided here are strictly at your own risk. You accept full responsibility for any decisions or outcomes arising from your use of this website and agree to release us from any liability in connection with your use of, or reliance upon, the content or products found herein.