
|
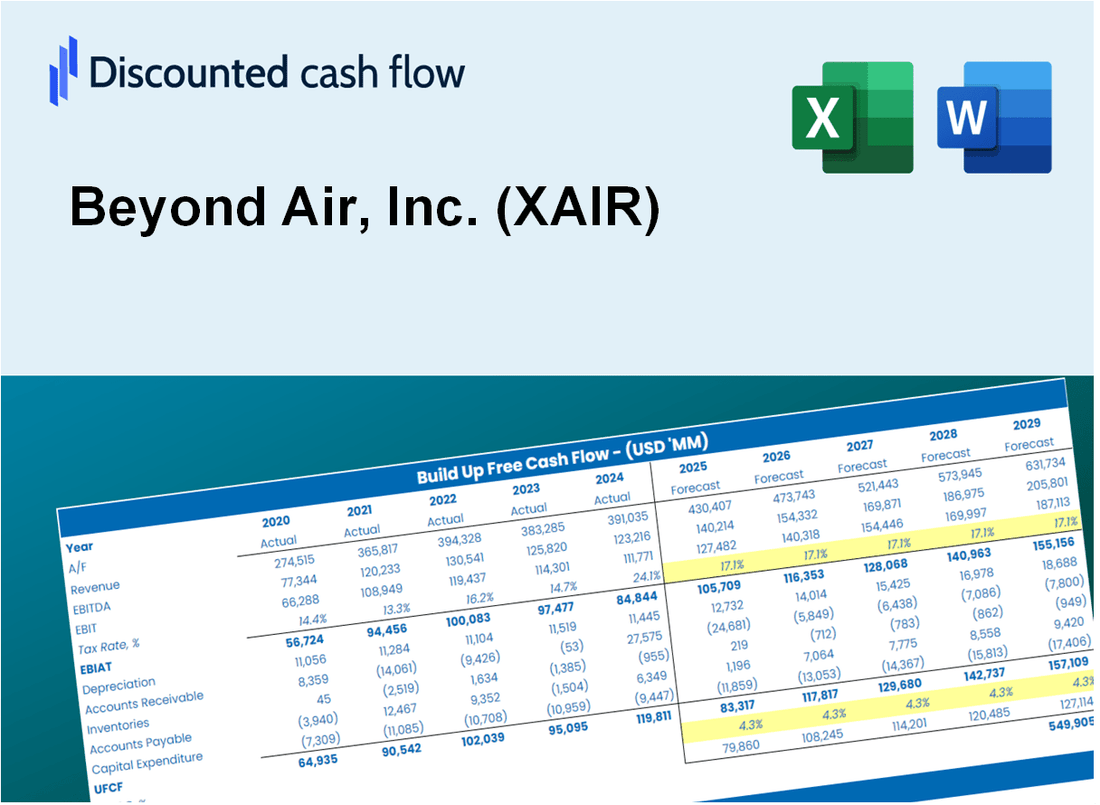
Beyond Air, Inc. (Xair) DCF -Bewertung |
Fully Editable: Tailor To Your Needs In Excel Or Sheets
Professional Design: Trusted, Industry-Standard Templates
Investor-Approved Valuation Models
MAC/PC Compatible, Fully Unlocked
No Expertise Is Needed; Easy To Follow
Beyond Air, Inc. (XAIR) Bundle
Entdecken Sie das finanzielle Potenzial von Beyond Air, Inc. (XAIR) mit unserem benutzerfreundlichen DCF-Taschenrechner! Geben Sie Ihre Prognosen für Wachstum, Margen und Kosten ein, um den inneren Wert von Beyond Air, Inc. (Xair) zu berechnen und Ihren Investitionsansatz zu informieren.
What You Will Get
- Editable Forecast Inputs: Easily modify assumptions (growth %, margins, WACC) to explore various scenarios.
- Real-World Data: Beyond Air, Inc. (XAIR) financial data pre-filled to accelerate your analysis.
- Automatic DCF Outputs: The template computes Net Present Value (NPV) and intrinsic value automatically.
- Customizable and Professional: A sleek Excel model that adjusts to your valuation requirements.
- Built for Analysts and Investors: Perfect for testing projections, validating strategies, and enhancing efficiency.
Key Features
- Accurate Financial Data: Gain access to reliable pre-loaded historical figures and future forecasts for Beyond Air, Inc. (XAIR).
- Adjustable Forecast Parameters: Modify highlighted cells for key metrics such as WACC, growth rates, and profit margins.
- Real-Time Calculations: Instant updates to DCF, Net Present Value (NPV), and cash flow analyses.
- User-Friendly Dashboard: Clear and concise charts and summaries to help you visualize valuation outcomes.
- Designed for All Users: A straightforward, intuitive layout tailored for investors, CFOs, and consultants alike.
How It Works
- Step 1: Download the prebuilt Excel template featuring Beyond Air, Inc. (XAIR) data.
- Step 2: Navigate through the pre-filled sheets to familiarize yourself with the essential metrics.
- Step 3: Adjust forecasts and assumptions in the editable yellow cells (WACC, growth, margins).
- Step 4: Instantly see the recalculated results, including the intrinsic value of Beyond Air, Inc. (XAIR).
- Step 5: Make well-informed investment decisions or create reports based on the results.
Why Choose Beyond Air, Inc. (XAIR)?
- Innovative Solutions: Leverage cutting-edge technologies for enhanced respiratory care.
- Proven Results: Our products have demonstrated significant clinical benefits in real-world settings.
- Patient-Centric Approach: Focused on improving patient outcomes and quality of life.
- Expert Support: Our team of professionals is dedicated to providing exceptional service and guidance.
- Industry Recognition: A trusted name in the healthcare sector, backed by numerous accolades.
Who Should Use Beyond Air, Inc. (XAIR)?
- Healthcare Professionals: Explore innovative treatment options and their financial implications.
- Researchers: Integrate advanced models into studies focused on respiratory therapies.
- Investors: Evaluate your investment strategies and assess the market potential of Beyond Air, Inc. (XAIR).
- Analysts: Enhance your analysis with a customizable financial model tailored for biotech firms.
- Entrepreneurs: Understand how public companies like Beyond Air, Inc. (XAIR) navigate the healthcare landscape.
What the Template Contains
- Pre-Filled Data: Includes Beyond Air, Inc.’s historical financials and forecasts.
- Discounted Cash Flow Model: Editable DCF valuation model with automatic calculations.
- Weighted Average Cost of Capital (WACC): A dedicated sheet for calculating WACC based on custom inputs.
- Key Financial Ratios: Analyze Beyond Air, Inc.'s profitability, efficiency, and leverage.
- Customizable Inputs: Edit revenue growth, margins, and tax rates with ease.
- Clear Dashboard: Charts and tables summarizing key valuation results.
Disclaimer
All information, articles, and product details provided on this website are for general informational and educational purposes only. We do not claim any ownership over, nor do we intend to infringe upon, any trademarks, copyrights, logos, brand names, or other intellectual property mentioned or depicted on this site. Such intellectual property remains the property of its respective owners, and any references here are made solely for identification or informational purposes, without implying any affiliation, endorsement, or partnership.
We make no representations or warranties, express or implied, regarding the accuracy, completeness, or suitability of any content or products presented. Nothing on this website should be construed as legal, tax, investment, financial, medical, or other professional advice. In addition, no part of this site—including articles or product references—constitutes a solicitation, recommendation, endorsement, advertisement, or offer to buy or sell any securities, franchises, or other financial instruments, particularly in jurisdictions where such activity would be unlawful.
All content is of a general nature and may not address the specific circumstances of any individual or entity. It is not a substitute for professional advice or services. Any actions you take based on the information provided here are strictly at your own risk. You accept full responsibility for any decisions or outcomes arising from your use of this website and agree to release us from any liability in connection with your use of, or reliance upon, the content or products found herein.