
|
Xunlei Limited (XNET) DCF -Bewertung |
Fully Editable: Tailor To Your Needs In Excel Or Sheets
Professional Design: Trusted, Industry-Standard Templates
Investor-Approved Valuation Models
MAC/PC Compatible, Fully Unlocked
No Expertise Is Needed; Easy To Follow
Xunlei Limited (XNET) Bundle
Verbessern Sie Ihre Anlagestrategie mit dem Xunlei Limited (XNET) DCF -Taschenrechner! Analysieren Sie echte Xunlei -Finanzdaten, passen Sie Wachstumsvorhersagen und -kosten an und beobachten Sie sofort, wie sich diese Veränderungen auf den intrinsischen Wert von Xunlei Limited (XNET) auswirken.
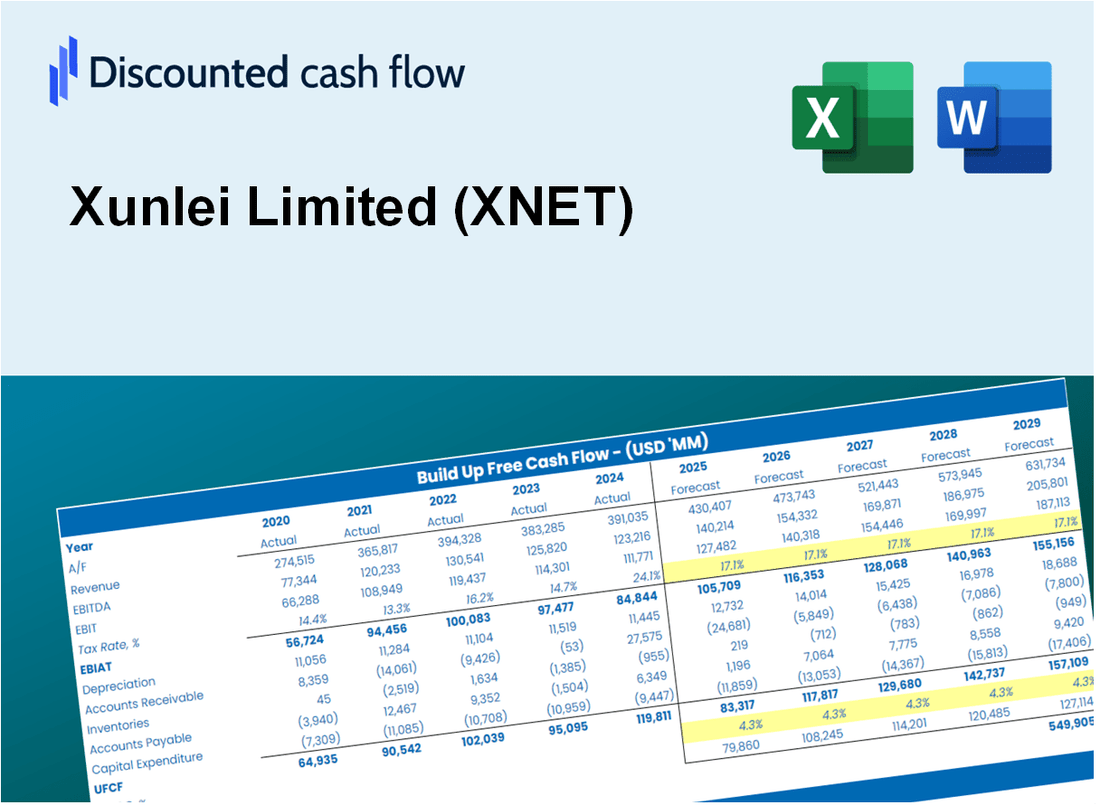
Discounted Cash Flow (DCF) - (USD MM)
| Year | AY1 2020 |
AY2 2021 |
AY3 2022 |
AY4 2023 |
AY5 2024 |
FY1 2025 |
FY2 2026 |
FY3 2027 |
FY4 2028 |
FY5 2029 |
|---|---|---|---|---|---|---|---|---|---|---|
| Revenue | 186.4 | 238.8 | 341.5 | 363.7 | 323.1 | 376.9 | 439.5 | 512.5 | 597.7 | 697.1 |
| Revenue Growth, % | 0 | 28.12 | 43.02 | 6.51 | -11.16 | 16.62 | 16.62 | 16.62 | 16.62 | 16.62 |
| EBITDA | 1.6 | 10.5 | 29.3 | 26.0 | 5.3 | 17.0 | 19.9 | 23.2 | 27.0 | 31.5 |
| EBITDA, % | 0.85475 | 4.38 | 8.58 | 7.15 | 1.64 | 4.52 | 4.52 | 4.52 | 4.52 | 4.52 |
| Depreciation | 14.2 | 9.4 | 3.8 | 6.1 | 6.9 | 12.4 | 14.5 | 16.9 | 19.7 | 23.0 |
| Depreciation, % | 7.61 | 3.93 | 1.12 | 1.67 | 2.14 | 3.29 | 3.29 | 3.29 | 3.29 | 3.29 |
| EBIT | -12.6 | 1.1 | 25.5 | 19.9 | -1.6 | 4.6 | 5.4 | 6.3 | 7.3 | 8.6 |
| EBIT, % | -6.75 | 0.45146 | 7.47 | 5.47 | -0.50412 | 1.23 | 1.23 | 1.23 | 1.23 | 1.23 |
| Total Cash | 255.1 | 239.0 | 262.3 | 271.9 | 287.5 | 332.0 | 387.2 | 451.6 | 526.7 | 614.2 |
| Total Cash, percent | .0 | .0 | .0 | .0 | .0 | .0 | .0 | .0 | .0 | .0 |
| Account Receivables | 35.8 | 41.5 | 43.0 | 43.0 | 65.9 | 61.4 | 71.6 | 83.5 | 97.4 | 113.5 |
| Account Receivables, % | 19.24 | 17.39 | 12.59 | 11.82 | 20.41 | 16.29 | 16.29 | 16.29 | 16.29 | 16.29 |
| Inventories | 1.7 | 1.4 | .5 | 2.2 | 1.3 | 2.0 | 2.3 | 2.7 | 3.1 | 3.7 |
| Inventories, % | 0.92611 | 0.57081 | 0.13382 | 0.61008 | 0.38838 | 0.52584 | 0.52584 | 0.52584 | 0.52584 | 0.52584 |
| Accounts Payable | 20.6 | 26.4 | 25.4 | 24.4 | 23.0 | 32.7 | 38.2 | 44.5 | 51.9 | 60.5 |
| Accounts Payable, % | 11.08 | 11.06 | 7.45 | 6.72 | 7.11 | 8.68 | 8.68 | 8.68 | 8.68 | 8.68 |
| Capital Expenditure | -13.6 | -13.3 | -15.0 | -4.5 | -8.3 | -15.9 | -18.5 | -21.6 | -25.2 | -29.4 |
| Capital Expenditure, % | -7.3 | -5.56 | -4.39 | -1.23 | -2.58 | -4.21 | -4.21 | -4.21 | -4.21 | -4.21 |
| Tax Rate, % | 151.55 | 151.55 | 151.55 | 151.55 | 151.55 | 151.55 | 151.55 | 151.55 | 151.55 | 151.55 |
| EBITAT | -13.4 | 1.3 | 21.5 | 15.4 | .8 | 3.3 | 3.9 | 4.6 | 5.3 | 6.2 |
| Depreciation | ||||||||||
| Changes in Account Receivables | ||||||||||
| Changes in Inventories | ||||||||||
| Changes in Accounts Payable | ||||||||||
| Capital Expenditure | ||||||||||
| UFCF | -29.8 | -2.1 | 8.8 | 14.2 | -24.0 | 13.5 | -5.2 | -6.1 | -7.1 | -8.3 |
| WACC, % | 5.46 | 5.46 | 5.11 | 4.95 | 3.17 | 4.83 | 4.83 | 4.83 | 4.83 | 4.83 |
| PV UFCF | ||||||||||
| SUM PV UFCF | -9.7 | |||||||||
| Long Term Growth Rate, % | 1.00 | |||||||||
| Free cash flow (T + 1) | -8 | |||||||||
| Terminal Value | -219 | |||||||||
| Present Terminal Value | -173 | |||||||||
| Enterprise Value | -183 | |||||||||
| Net Debt | -148 | |||||||||
| Equity Value | -35 | |||||||||
| Diluted Shares Outstanding, MM | 3 | |||||||||
| Equity Value Per Share | -13.71 |
What You Will Receive
- Adjustable Forecast Inputs: Easily modify assumptions (growth %, profit margins, WACC) to explore various scenarios.
- Comprehensive Data: Xunlei Limited’s (XNET) financial information pre-loaded to facilitate your analysis.
- Instant DCF Outputs: The template automatically computes Net Present Value (NPV) and intrinsic value for you.
- Tailored and Professional: A refined Excel model that can be customized to meet your valuation requirements.
- Designed for Analysts and Investors: Perfect for evaluating projections, confirming strategies, and enhancing efficiency.
Key Features
- Comprehensive DCF Calculator: Offers both unlevered and levered DCF valuation models tailored for Xunlei Limited (XNET).
- WACC Calculator: Features a pre-configured Weighted Average Cost of Capital sheet with adjustable parameters.
- Customizable Forecast Assumptions: Adjust growth rates, capital expenditures, and discount rates to fit your analysis.
- Integrated Financial Ratios: Evaluate profitability, leverage, and efficiency ratios specifically for Xunlei Limited (XNET).
- Interactive Dashboard and Charts: Visual representations provide a summary of essential valuation metrics for straightforward analysis.
How It Works
- Step 1: Download the prebuilt Excel template featuring Xunlei Limited’s (XNET) data.
- Step 2: Review the pre-filled sheets to familiarize yourself with the essential metrics.
- Step 3: Modify forecasts and assumptions in the editable yellow cells (WACC, growth, margins).
- Step 4: Instantly see the recalculated results, including Xunlei Limited’s (XNET) intrinsic value.
- Step 5: Make informed investment choices or create reports based on the outputs.
Why Choose This Calculator for Xunlei Limited (XNET)?
- Designed for Experts: A sophisticated tool utilized by financial analysts, CFOs, and industry consultants.
- Accurate Data: Xunlei Limited’s historical and projected financials are preloaded for precise calculations.
- Flexible Scenario Analysis: Effortlessly simulate various forecasts and assumptions.
- Comprehensive Outputs: Automatically computes intrinsic value, NPV, and essential financial metrics.
- User-Friendly: Step-by-step guidance ensures a seamless experience.
Who Should Use This Product?
- Investors: Assess Xunlei Limited’s (XNET) market performance prior to making investment decisions.
- CFOs and Financial Analysts: Optimize valuation methodologies and evaluate financial forecasts.
- Startup Founders: Understand the valuation strategies of established tech companies like Xunlei Limited.
- Consultants: Provide comprehensive valuation analyses and reports for clients in the tech sector.
- Students and Educators: Utilize current data to learn and teach valuation principles effectively.
What the Template Contains
- Operating and Balance Sheet Data: Pre-filled Xunlei Limited (XNET) historical data and forecasts, including revenue, EBITDA, EBIT, and capital expenditures.
- WACC Calculation: A dedicated sheet for Weighted Average Cost of Capital (WACC), featuring parameters like Beta, risk-free rate, and share price.
- DCF Valuation (Unlevered and Levered): Editable Discounted Cash Flow models illustrating intrinsic value with comprehensive calculations.
- Financial Statements: Pre-loaded financial statements (annual and quarterly) to facilitate analysis.
- Key Ratios: Includes profitability, leverage, and efficiency ratios for Xunlei Limited (XNET).
- Dashboard and Charts: Visual summary of valuation outputs and assumptions for easy result analysis.
Disclaimer
All information, articles, and product details provided on this website are for general informational and educational purposes only. We do not claim any ownership over, nor do we intend to infringe upon, any trademarks, copyrights, logos, brand names, or other intellectual property mentioned or depicted on this site. Such intellectual property remains the property of its respective owners, and any references here are made solely for identification or informational purposes, without implying any affiliation, endorsement, or partnership.
We make no representations or warranties, express or implied, regarding the accuracy, completeness, or suitability of any content or products presented. Nothing on this website should be construed as legal, tax, investment, financial, medical, or other professional advice. In addition, no part of this site—including articles or product references—constitutes a solicitation, recommendation, endorsement, advertisement, or offer to buy or sell any securities, franchises, or other financial instruments, particularly in jurisdictions where such activity would be unlawful.
All content is of a general nature and may not address the specific circumstances of any individual or entity. It is not a substitute for professional advice or services. Any actions you take based on the information provided here are strictly at your own risk. You accept full responsibility for any decisions or outcomes arising from your use of this website and agree to release us from any liability in connection with your use of, or reliance upon, the content or products found herein.