
|
Xoma Corporation (Xoma) DCF -Bewertung |
Fully Editable: Tailor To Your Needs In Excel Or Sheets
Professional Design: Trusted, Industry-Standard Templates
Investor-Approved Valuation Models
MAC/PC Compatible, Fully Unlocked
No Expertise Is Needed; Easy To Follow
XOMA Corporation (XOMA) Bundle
Erforschen Sie den finanziellen Ausblick von Xoma Corporation (XAMA) mit unserem benutzerfreundlichen DCF-Taschenrechner! Geben Sie Ihre Prognosen für Wachstum, Margen und Ausgaben ein, um den inneren Wert von Xoma zu berechnen und Ihre Anlageentscheidungen zu informieren.
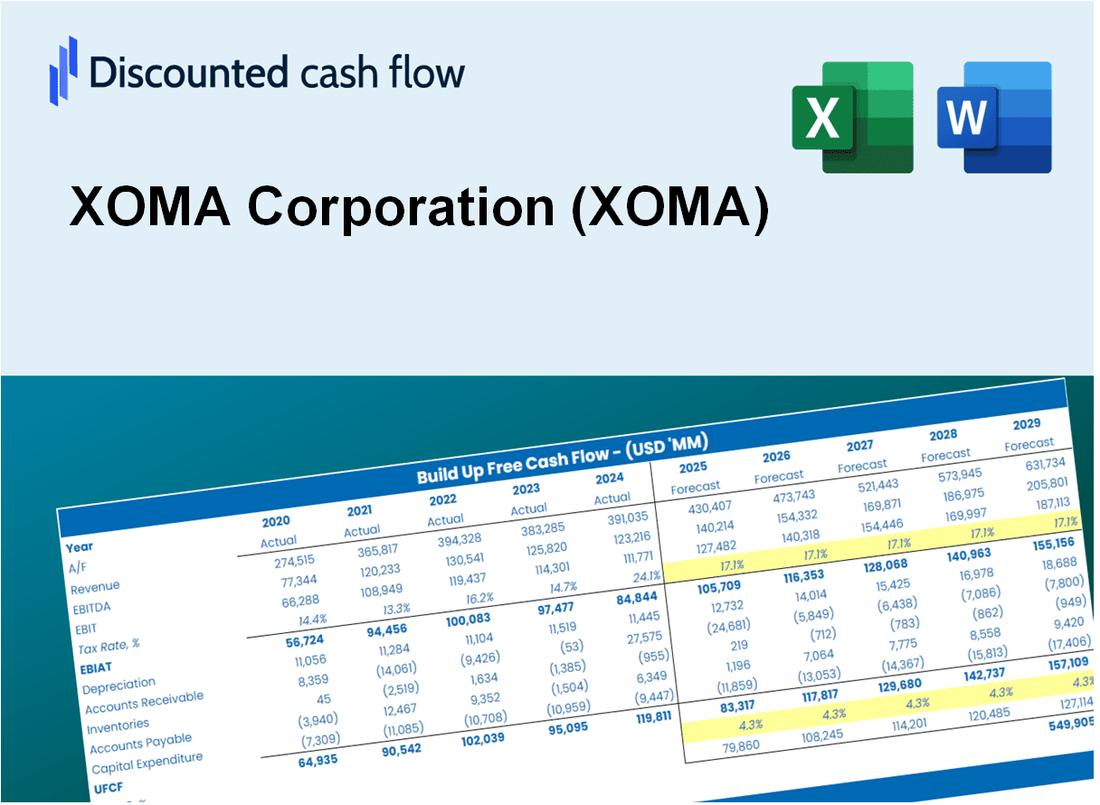
Discounted Cash Flow (DCF) - (USD MM)
| Year | AY1 2020 |
AY2 2021 |
AY3 2022 |
AY4 2023 |
AY5 2024 |
FY1 2025 |
FY2 2026 |
FY3 2027 |
FY4 2028 |
FY5 2029 |
|---|---|---|---|---|---|---|---|---|---|---|
| Revenue | 29.4 | 38.2 | 6.0 | 4.8 | 28.5 | 30.2 | 32.1 | 34.1 | 36.2 | 38.4 |
| Revenue Growth, % | 0 | 29.86 | -84.21 | -21.06 | 498.72 | 6.15 | 6.15 | 6.15 | 6.15 | 6.15 |
| EBITDA | 13.8 | 16.5 | -16.8 | -22.6 | -5.4 | -7.8 | -8.3 | -8.8 | -9.3 | -9.9 |
| EBITDA, % | 47.01 | 43.28 | -279.49 | -474.21 | -19.04 | -25.75 | -25.75 | -25.75 | -25.75 | -25.75 |
| Depreciation | .2 | .2 | .3 | .9 | .2 | 1.5 | 1.6 | 1.7 | 1.8 | 1.9 |
| Depreciation, % | 0.58533 | 0.43763 | 4.55 | 18.92 | 0.75824 | 5.05 | 5.05 | 5.05 | 5.05 | 5.05 |
| EBIT | 13.6 | 16.4 | -17.1 | -23.5 | -5.6 | -7.9 | -8.4 | -8.9 | -9.4 | -10.0 |
| EBIT, % | 46.42 | 42.85 | -284.04 | -493.13 | -19.79 | -26.11 | -26.11 | -26.11 | -26.11 | -26.11 |
| Total Cash | 84.2 | 94.1 | 58.2 | 153.5 | 105.2 | 30.2 | 32.1 | 34.1 | 36.2 | 38.4 |
| Total Cash, percent | .0 | .0 | .0 | .0 | .0 | .0 | .0 | .0 | .0 | .0 |
| Account Receivables | 1.8 | .2 | 2.4 | 15.2 | 17.0 | 12.4 | 13.2 | 14.0 | 14.9 | 15.8 |
| Account Receivables, % | 6.09 | 0.54769 | 39.27 | 319.86 | 59.73 | 41.13 | 41.13 | 41.13 | 41.13 | 41.13 |
| Inventories | 1.6 | .0 | .0 | .0 | .0 | .3 | .4 | .4 | .4 | .4 |
| Inventories, % | 5.48 | 0 | 0 | 0 | 0 | 1.1 | 1.1 | 1.1 | 1.1 | 1.1 |
| Accounts Payable | .5 | 1.1 | .5 | .7 | 1.1 | 1.8 | 2.0 | 2.1 | 2.2 | 2.3 |
| Accounts Payable, % | 1.55 | 2.81 | 8.69 | 13.72 | 3.7 | 6.1 | 6.1 | 6.1 | 6.1 | 6.1 |
| Capital Expenditure | -1.2 | -26.5 | -15.2 | .0 | .0 | -10.5 | -11.2 | -11.9 | -12.6 | -13.4 |
| Capital Expenditure, % | -4.11 | -69.44 | -252.98 | -0.35729 | -0.07020746 | -34.8 | -34.8 | -34.8 | -34.8 | -34.8 |
| Tax Rate, % | 29.05 | 29.05 | 29.05 | 29.05 | 29.05 | 29.05 | 29.05 | 29.05 | 29.05 | 29.05 |
| EBITAT | 15.4 | 16.3 | -17.1 | -23.5 | -4.0 | -7.4 | -7.9 | -8.4 | -8.9 | -9.4 |
| Depreciation | ||||||||||
| Changes in Account Receivables | ||||||||||
| Changes in Inventories | ||||||||||
| Changes in Accounts Payable | ||||||||||
| Capital Expenditure | ||||||||||
| UFCF | 11.4 | -6.3 | -34.8 | -35.3 | -5.2 | -11.4 | -18.1 | -19.2 | -20.4 | -21.7 |
| WACC, % | 9 | 8.98 | 8.99 | 9 | 8.2 | 8.83 | 8.83 | 8.83 | 8.83 | 8.83 |
| PV UFCF | ||||||||||
| SUM PV UFCF | -69.4 | |||||||||
| Long Term Growth Rate, % | 2.00 | |||||||||
| Free cash flow (T + 1) | -22 | |||||||||
| Terminal Value | -323 | |||||||||
| Present Terminal Value | -212 | |||||||||
| Enterprise Value | -281 | |||||||||
| Net Debt | 18 | |||||||||
| Equity Value | -299 | |||||||||
| Diluted Shares Outstanding, MM | 12 | |||||||||
| Equity Value Per Share | -25.52 |
What You Will Receive
- Pre-Loaded Financial Model: XOMA Corporation’s actual data provides accurate DCF valuation.
- Comprehensive Forecast Control: Modify revenue growth, profit margins, WACC, and other essential parameters.
- Real-Time Calculations: Automatic updates ensure immediate visibility of results as adjustments are made.
- Professional-Grade Template: A polished Excel file crafted for high-quality valuation presentations.
- Flexible and Reusable: Designed for adaptability, allowing for repeated utilization for in-depth forecasts.
Key Features
- Comprehensive DCF Calculator: Features detailed unlevered and levered DCF valuation models tailored for XOMA Corporation (XOMA).
- WACC Calculator: Pre-configured Weighted Average Cost of Capital sheet with adjustable inputs specific to XOMA.
- Customizable Forecast Assumptions: Adjust growth rates, capital expenditures, and discount rates to fit XOMA's financial strategy.
- Integrated Financial Ratios: Evaluate profitability, leverage, and efficiency ratios for XOMA Corporation (XOMA).
- Visual Dashboard and Charts: Graphical representations summarize essential valuation metrics for straightforward analysis of XOMA.
How It Works
- 1. Access the Template: Download and open the Excel file containing XOMA Corporation’s preloaded data.
- 2. Adjust Key Inputs: Modify essential parameters such as growth rates, WACC, and capital expenditures.
- 3. Analyze Results Immediately: The DCF model automatically computes intrinsic value and NPV in real-time.
- 4. Explore Different Scenarios: Evaluate various forecasts to assess different valuation possibilities.
- 5. Present with Assurance: Deliver professional valuation insights to enhance your decision-making process.
Why Choose XOMA Corporation (XOMA)?
- Innovative Solutions: Cutting-edge technology and research drive our advancements.
- Proven Track Record: Our history of successful projects demonstrates our expertise.
- Collaborative Approach: We work closely with partners to achieve shared goals.
- Commitment to Quality: Rigorous standards ensure the highest level of service and products.
- Expert Team: Our professionals are dedicated to providing exceptional support and insights.
Who Should Use This Product?
- Professional Investors: Develop comprehensive and accurate valuation models for assessing XOMA Corporation (XOMA) investments.
- Corporate Finance Teams: Evaluate valuation scenarios to inform strategic decisions within the organization.
- Consultants and Advisors: Deliver precise valuation insights for clients interested in XOMA Corporation (XOMA).
- Students and Educators: Utilize real market data to enhance learning and practice in financial modeling.
- Biotech Enthusiasts: Gain insights into how biotech firms like XOMA Corporation (XOMA) are valued in the financial landscape.
What the Template Contains
- Historical Data: Includes XOMA Corporation’s past financials and baseline forecasts.
- DCF and Levered DCF Models: Detailed templates to calculate XOMA’s intrinsic value.
- WACC Sheet: Pre-built calculations for Weighted Average Cost of Capital.
- Editable Inputs: Modify key drivers like growth rates, EBITDA %, and CAPEX assumptions.
- Quarterly and Annual Statements: A complete breakdown of XOMA Corporation’s financials.
- Interactive Dashboard: Visualize valuation results and projections dynamically.
Disclaimer
All information, articles, and product details provided on this website are for general informational and educational purposes only. We do not claim any ownership over, nor do we intend to infringe upon, any trademarks, copyrights, logos, brand names, or other intellectual property mentioned or depicted on this site. Such intellectual property remains the property of its respective owners, and any references here are made solely for identification or informational purposes, without implying any affiliation, endorsement, or partnership.
We make no representations or warranties, express or implied, regarding the accuracy, completeness, or suitability of any content or products presented. Nothing on this website should be construed as legal, tax, investment, financial, medical, or other professional advice. In addition, no part of this site—including articles or product references—constitutes a solicitation, recommendation, endorsement, advertisement, or offer to buy or sell any securities, franchises, or other financial instruments, particularly in jurisdictions where such activity would be unlawful.
All content is of a general nature and may not address the specific circumstances of any individual or entity. It is not a substitute for professional advice or services. Any actions you take based on the information provided here are strictly at your own risk. You accept full responsibility for any decisions or outcomes arising from your use of this website and agree to release us from any liability in connection with your use of, or reliance upon, the content or products found herein.