
|
XPS Pensions Group Plc (XPs.L) DCF -Bewertung |
Fully Editable: Tailor To Your Needs In Excel Or Sheets
Professional Design: Trusted, Industry-Standard Templates
Investor-Approved Valuation Models
MAC/PC Compatible, Fully Unlocked
No Expertise Is Needed; Easy To Follow
XPS Pensions Group plc (XPS.L) Bundle
Bewerten Sie die finanziellen Aussichten von XPS Pension Group PLC wie ein Experte! Dieser (XPSL) DCF-Taschenrechner bietet Ihnen vorgefüllte Finanzdaten und vollständige Flexibilität, um das Umsatzwachstum, WACC, Margen und andere wesentliche Annahmen zu ändern, um sich mit Ihren Vorhersagen auszurichten.
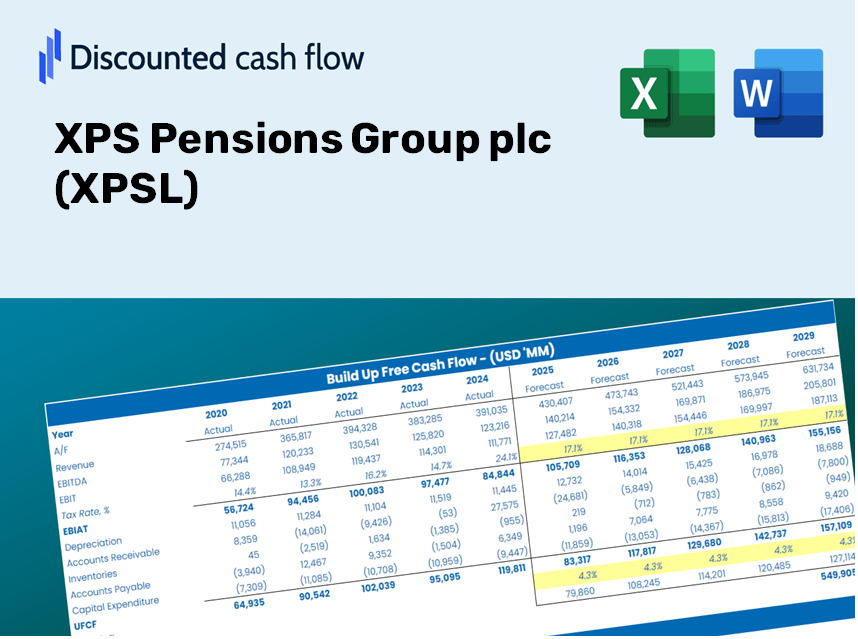
Discounted Cash Flow (DCF) - (USD MM)
| Year | AY1 2020 |
AY2 2021 |
AY3 2022 |
AY4 2023 |
AY5 2024 |
FY1 2025 |
FY2 2026 |
FY3 2027 |
FY4 2028 |
FY5 2029 |
|---|---|---|---|---|---|---|---|---|---|---|
| Revenue | 127.9 | 138.6 | 166.8 | 199.4 | 231.8 | 269.1 | 312.5 | 362.9 | 421.4 | 489.3 |
| Revenue Growth, % | 0 | 8.36 | 20.32 | 19.57 | 16.22 | 16.12 | 16.12 | 16.12 | 16.12 | 16.12 |
| EBITDA | 27.1 | 30.3 | 37.8 | 79.3 | 57.3 | 70.0 | 81.3 | 94.4 | 109.7 | 127.3 |
| EBITDA, % | 21.17 | 21.83 | 22.66 | 39.75 | 24.71 | 26.02 | 26.02 | 26.02 | 26.02 | 26.02 |
| Depreciation | 11.5 | 11.9 | 12.4 | 12.8 | 13.8 | 20.1 | 23.4 | 27.1 | 31.5 | 36.6 |
| Depreciation, % | 8.97 | 8.6 | 7.43 | 6.44 | 5.97 | 7.48 | 7.48 | 7.48 | 7.48 | 7.48 |
| EBIT | 15.6 | 18.3 | 25.4 | 66.4 | 43.4 | 49.9 | 58.0 | 67.3 | 78.1 | 90.7 |
| EBIT, % | 12.2 | 13.23 | 15.23 | 33.31 | 18.74 | 18.54 | 18.54 | 18.54 | 18.54 | 18.54 |
| Total Cash | 8.6 | 10.2 | 13.3 | 10.0 | 14.7 | 18.0 | 20.9 | 24.2 | 28.1 | 32.7 |
| Total Cash, percent | .0 | .0 | .0 | .0 | .0 | .0 | .0 | .0 | .0 | .0 |
| Account Receivables | 18.4 | 19.2 | 22.9 | 45.4 | 51.0 | 46.7 | 54.2 | 63.0 | 73.1 | 84.9 |
| Account Receivables, % | 14.4 | 13.88 | 13.71 | 22.76 | 22.01 | 17.35 | 17.35 | 17.35 | 17.35 | 17.35 |
| Inventories | .0 | .0 | .0 | -17.0 | .0 | -4.6 | -5.3 | -6.2 | -7.2 | -8.3 |
| Inventories, % | 0 | 0 | 0 | -8.52 | 0 | -1.7 | -1.7 | -1.7 | -1.7 | -1.7 |
| Accounts Payable | 4.7 | 8.6 | 31.2 | 2.8 | 7.9 | 18.0 | 20.9 | 24.3 | 28.2 | 32.8 |
| Accounts Payable, % | 3.71 | 6.23 | 18.72 | 1.42 | 3.4 | 6.7 | 6.7 | 6.7 | 6.7 | 6.7 |
| Capital Expenditure | -2.9 | -9.3 | -5.5 | -7.5 | -8.2 | -10.5 | -12.2 | -14.2 | -16.5 | -19.1 |
| Capital Expenditure, % | -2.26 | -6.74 | -3.27 | -3.76 | -3.53 | -3.91 | -3.91 | -3.91 | -3.91 | -3.91 |
| Tax Rate, % | 25.54 | 25.54 | 25.54 | 25.54 | 25.54 | 25.54 | 25.54 | 25.54 | 25.54 | 25.54 |
| EBITAT | 12.3 | 10.2 | 21.0 | 57.6 | 32.3 | 37.8 | 43.9 | 50.9 | 59.1 | 68.7 |
| Depreciation | ||||||||||
| Changes in Account Receivables | ||||||||||
| Changes in Inventories | ||||||||||
| Changes in Accounts Payable | ||||||||||
| Capital Expenditure | ||||||||||
| UFCF | 7.2 | 15.9 | 46.9 | 29.0 | 20.4 | 66.4 | 51.1 | 59.4 | 68.9 | 80.0 |
| WACC, % | 4.75 | 4.67 | 4.76 | 4.77 | 4.73 | 4.73 | 4.73 | 4.73 | 4.73 | 4.73 |
| PV UFCF | ||||||||||
| SUM PV UFCF | 282.4 | |||||||||
| Long Term Growth Rate, % | 2.00 | |||||||||
| Free cash flow (T + 1) | 82 | |||||||||
| Terminal Value | 2,985 | |||||||||
| Present Terminal Value | 2,369 | |||||||||
| Enterprise Value | 2,651 | |||||||||
| Net Debt | 54 | |||||||||
| Equity Value | 2,597 | |||||||||
| Diluted Shares Outstanding, MM | 219 | |||||||||
| Equity Value Per Share | 1,183.34 |
What You Will Receive
- Adjustable Forecast Assumptions: Easily modify parameters (growth %, margins, WACC) to explore various scenarios.
- Comprehensive Data: XPS Pensions Group plc's (XPSL) financial information pre-loaded to facilitate your analysis.
- Automated DCF Calculations: The template computes Net Present Value (NPV) and intrinsic value automatically.
- Tailored and Professional: A refined Excel model that can be customized to fit your valuation requirements.
- Designed for Analysts and Investors: Perfect for evaluating projections, confirming strategies, and enhancing efficiency.
Core Features
- Customizable Projection Inputs: Adjust essential factors such as revenue growth, EBITDA percentage, and capital expenditures.
- Instant DCF Valuation: Quickly derives intrinsic value, NPV, and additional metrics with ease.
- High Precision Standards: Leverages XPS Pensions Group plc’s (XPSL) actual financial data for accurate appraisal results.
- Streamlined Scenario Analysis: Effortlessly evaluate various assumptions and analyze different outcomes.
- Efficiency-Boosting Solution: Avoid the complexities of building detailed valuation models from the ground up.
How It Works
- Step 1: Download the Excel spreadsheet.
- Step 2: Examine the pre-filled data for XPS Pensions Group plc (XPSL) including historical and projected figures.
- Step 3: Modify the key assumptions (highlighted in yellow) according to your analysis.
- Step 4: Observe the automatic recalculations of XPS Pensions Group plc's (XPSL) intrinsic value.
- Step 5: Utilize the results for making investment decisions or for reporting purposes.
Why Opt for This Calculator?
- Reliable Data: Accurate financial metrics from XPS Pensions Group plc (XPSL) ensure trustworthy valuation outcomes.
- Customizable Features: Modify essential inputs such as growth rates, WACC, and tax rates to align with your specific forecasts.
- Efficiency Boost: Pre-configured calculations save you time and effort, eliminating the need to build from the ground up.
- Expert-Level Tool: Tailored for investors, analysts, and consultants in the pension sector.
- User-Friendly Interface: An intuitive design and clear step-by-step guidance make it accessible for users at all experience levels.
Who Can Benefit from This Product?
- Finance Students: Master valuation methods and apply them to real market data.
- Academics: Enhance your curriculum or research by integrating industry-standard models.
- Investors: Evaluate your investment hypotheses and assess valuation results for XPS Pensions Group plc (XPSL).
- Analysts: Optimize your analysis process with a ready-made, adjustable DCF model.
- Small Business Owners: Understand how major public companies like XPS Pensions Group plc (XPSL) are valued in the market.
Contents of the Template
- Pre-Filled DCF Model: Financial data for XPS Pensions Group plc (XPSL) preloaded for immediate application.
- WACC Calculator: Comprehensive calculations for the Weighted Average Cost of Capital.
- Financial Ratios: Assess XPSL’s profitability, leverage, and operational efficiency.
- Editable Inputs: Modify assumptions such as growth rates, profit margins, and capital expenditures to suit your analyses.
- Financial Statements: Access annual and quarterly reports to facilitate in-depth analysis.
- Interactive Dashboard: Effortlessly visualize essential valuation metrics and outcomes.
Disclaimer
All information, articles, and product details provided on this website are for general informational and educational purposes only. We do not claim any ownership over, nor do we intend to infringe upon, any trademarks, copyrights, logos, brand names, or other intellectual property mentioned or depicted on this site. Such intellectual property remains the property of its respective owners, and any references here are made solely for identification or informational purposes, without implying any affiliation, endorsement, or partnership.
We make no representations or warranties, express or implied, regarding the accuracy, completeness, or suitability of any content or products presented. Nothing on this website should be construed as legal, tax, investment, financial, medical, or other professional advice. In addition, no part of this site—including articles or product references—constitutes a solicitation, recommendation, endorsement, advertisement, or offer to buy or sell any securities, franchises, or other financial instruments, particularly in jurisdictions where such activity would be unlawful.
All content is of a general nature and may not address the specific circumstances of any individual or entity. It is not a substitute for professional advice or services. Any actions you take based on the information provided here are strictly at your own risk. You accept full responsibility for any decisions or outcomes arising from your use of this website and agree to release us from any liability in connection with your use of, or reliance upon, the content or products found herein.