
|
Yalla Group Limited (YALA) DCF -Bewertung |
Fully Editable: Tailor To Your Needs In Excel Or Sheets
Professional Design: Trusted, Industry-Standard Templates
Investor-Approved Valuation Models
MAC/PC Compatible, Fully Unlocked
No Expertise Is Needed; Easy To Follow
Yalla Group Limited (YALA) Bundle
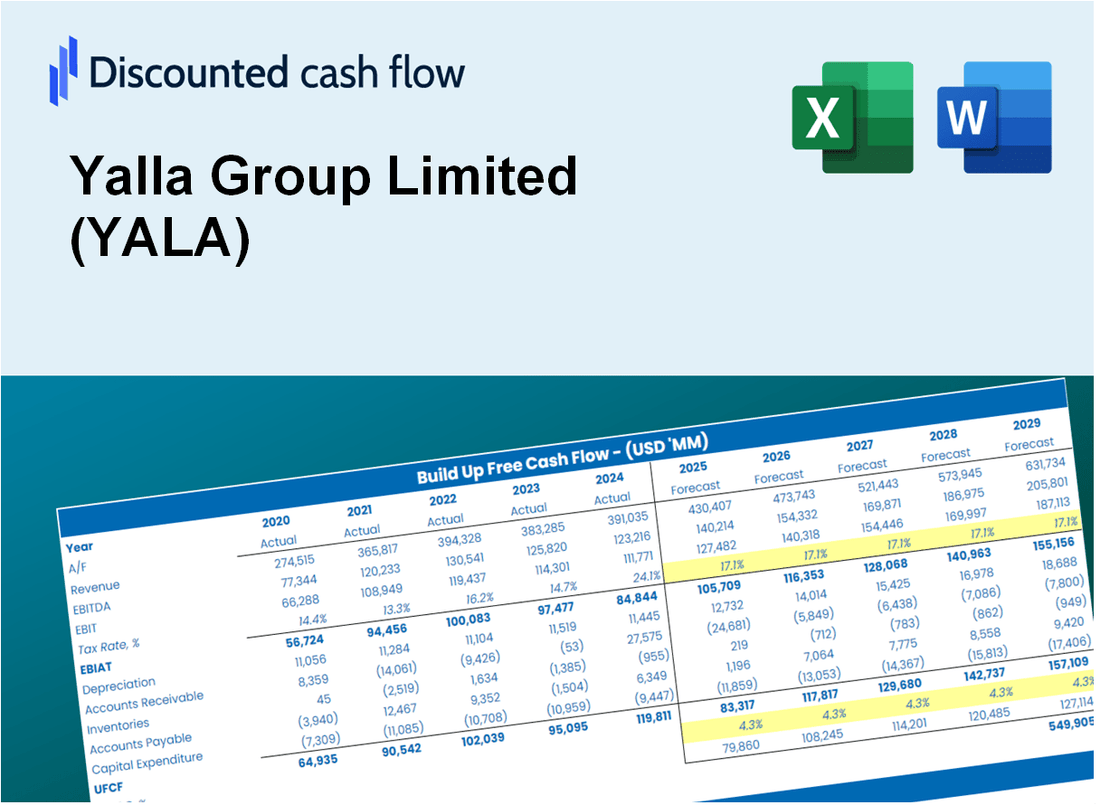
Gewinnen Sie einen Einblick in Ihre Yalla Group Limited (YALA) Bewertungsanalyse mit unserem hochmodernen DCF-Taschenrechner! Diese Excel -Vorlage mit realen YALA -Daten ermöglicht es Ihnen, Prognosen und Annahmen anzupassen, um den inneren Wert der Yalla Group Limited genau zu bestimmen.
Discounted Cash Flow (DCF) - (USD MM)
| Year | AY1 2020 |
AY2 2021 |
AY3 2022 |
AY4 2023 |
AY5 2024 |
FY1 2025 |
FY2 2026 |
FY3 2027 |
FY4 2028 |
FY5 2029 |
|---|---|---|---|---|---|---|---|---|---|---|
| Revenue | 134.9 | 273.1 | 303.6 | 318.9 | 339.7 | 402.0 | 475.9 | 563.2 | 666.7 | 789.1 |
| Revenue Growth, % | 0 | 102.43 | 11.16 | 5.03 | 6.52 | 18.36 | 18.36 | 18.36 | 18.36 | 18.36 |
| EBITDA | 4.3 | 85.3 | 82.8 | 98.4 | 122.7 | 103.5 | 122.5 | 145.0 | 171.6 | 203.1 |
| EBITDA, % | 3.21 | 31.23 | 27.26 | 30.85 | 36.14 | 25.74 | 25.74 | 25.74 | 25.74 | 25.74 |
| Depreciation | .3 | .9 | 1.1 | 2.0 | 1.3 | 1.5 | 1.8 | 2.1 | 2.5 | 3.0 |
| Depreciation, % | 0.19432 | 0.31134 | 0.37322 | 0.63201 | 0.39653 | 0.38148 | 0.38148 | 0.38148 | 0.38148 | 0.38148 |
| EBIT | 4.1 | 84.4 | 81.6 | 96.4 | 121.4 | 101.9 | 120.7 | 142.8 | 169.0 | 200.1 |
| EBIT, % | 3.02 | 30.92 | 26.89 | 30.22 | 35.74 | 25.36 | 25.36 | 25.36 | 25.36 | 25.36 |
| Total Cash | 237.6 | 354.4 | 453.0 | 535.3 | 654.3 | 402.0 | 475.9 | 563.2 | 666.7 | 789.1 |
| Total Cash, percent | .0 | .0 | .0 | .0 | .0 | .0 | .0 | .0 | .0 | .0 |
| Account Receivables | 14.2 | 17.3 | 24.2 | .1 | 31.9 | 27.6 | 32.6 | 38.6 | 45.7 | 54.1 |
| Account Receivables, % | 10.55 | 6.34 | 7.96 | 0.03434171 | 9.4 | 6.86 | 6.86 | 6.86 | 6.86 | 6.86 |
| Inventories | .0 | .0 | -24.2 | .0 | .0 | -6.4 | -7.6 | -9.0 | -10.6 | -12.6 |
| Inventories, % | 0 | 0 | -7.96 | 0 | 0 | -1.59 | -1.59 | -1.59 | -1.59 | -1.59 |
| Accounts Payable | 1.6 | 4.4 | 5.4 | .9 | 1.0 | 4.1 | 4.9 | 5.8 | 6.8 | 8.1 |
| Accounts Payable, % | 1.17 | 1.61 | 1.77 | 0.29104 | 0.28195 | 1.02 | 1.02 | 1.02 | 1.02 | 1.02 |
| Capital Expenditure | -1.0 | -1.5 | -16.3 | -1.6 | -.8 | -6.0 | -7.1 | -8.4 | -9.9 | -11.8 |
| Capital Expenditure, % | -0.76312 | -0.54506 | -5.38 | -0.51707 | -0.24834 | -1.49 | -1.49 | -1.49 | -1.49 | -1.49 |
| Tax Rate, % | 8.36 | 8.36 | 8.36 | 8.36 | 8.36 | 8.36 | 8.36 | 8.36 | 8.36 | 8.36 |
| EBITAT | 3.2 | 82.4 | 79.8 | 97.7 | 111.2 | 95.0 | 112.4 | 133.1 | 157.5 | 186.4 |
| Depreciation | ||||||||||
| Changes in Account Receivables | ||||||||||
| Changes in Inventories | ||||||||||
| Changes in Accounts Payable | ||||||||||
| Capital Expenditure | ||||||||||
| UFCF | -10.2 | 81.5 | 82.9 | 93.5 | 80.0 | 104.4 | 104.0 | 123.1 | 145.7 | 172.5 |
| WACC, % | 7.3 | 7.3 | 7.3 | 7.3 | 7.3 | 7.3 | 7.3 | 7.3 | 7.3 | 7.3 |
| PV UFCF | ||||||||||
| SUM PV UFCF | 518.5 | |||||||||
| Long Term Growth Rate, % | 0.50 | |||||||||
| Free cash flow (T + 1) | 173 | |||||||||
| Terminal Value | 2,550 | |||||||||
| Present Terminal Value | 1,793 | |||||||||
| Enterprise Value | 2,312 | |||||||||
| Net Debt | -487 | |||||||||
| Equity Value | 2,799 | |||||||||
| Diluted Shares Outstanding, MM | 183 | |||||||||
| Equity Value Per Share | 15.28 |
What You Will Get
- Real YALA Financials: Access to historical and projected data for precise valuation.
- Customizable Inputs: Adjust WACC, tax rates, revenue growth, and capital expenditures as needed.
- Dynamic Calculations: Intrinsic value and NPV are computed in real-time.
- Scenario Analysis: Evaluate various scenarios to assess Yalla Group Limited's future performance.
- User-Friendly Design: Designed for professionals while remaining accessible to newcomers.
Key Features
- 🔍 Real-Life YALA Financials: Pre-filled historical and projected data for Yalla Group Limited (YALA).
- ✏️ Fully Customizable Inputs: Adjust all critical parameters (yellow cells) like WACC, growth %, and tax rates.
- 📊 Professional DCF Valuation: Built-in formulas calculate Yalla’s intrinsic value using the Discounted Cash Flow method.
- ⚡ Instant Results: Visualize Yalla’s valuation instantly after making changes.
- Scenario Analysis: Test and compare outcomes for various financial assumptions side-by-side.
How It Works
- Step 1: Download the Excel file for Yalla Group Limited (YALA).
- Step 2: Review Yalla Group’s pre-filled financial data and forecasts.
- Step 3: Modify key inputs such as revenue growth, WACC, and tax rates (highlighted cells).
- Step 4: Observe the DCF model update in real-time as you adjust your assumptions.
- Step 5: Analyze the outputs and leverage the results for your investment decisions.
Why Choose This Calculator for Yalla Group Limited (YALA)?
- Accurate Data: Up-to-date financial information for Yalla Group Limited ensures dependable valuation outcomes.
- Customizable: Tailor essential inputs like growth rates, WACC, and tax rates to align with your forecasts.
- Time-Saving: Pre-configured calculations save you the hassle of starting from scratch.
- Professional-Grade Tool: Crafted for investors, analysts, and consultants focused on Yalla Group Limited.
- User-Friendly: Easy-to-navigate design and clear instructions make it accessible for all users.
Who Should Use This Product?
- Finance Students: Master valuation methods and implement them with real-time data for Yalla Group Limited (YALA).
- Academics: Integrate industry-standard models into your lectures or research focused on Yalla Group Limited (YALA).
- Investors: Evaluate your hypotheses and scrutinize valuation results for Yalla Group Limited (YALA).
- Analysts: Enhance your efficiency with a ready-to-use, customizable DCF model tailored for Yalla Group Limited (YALA).
- Small Business Owners: Understand the analytical approaches used for large public companies like Yalla Group Limited (YALA).
What the Template Contains
- Operating and Balance Sheet Data: Pre-filled Yalla Group Limited (YALA) historical data and forecasts, including revenue, EBITDA, EBIT, and capital expenditures.
- WACC Calculation: A dedicated sheet for Weighted Average Cost of Capital (WACC), including parameters like Beta, risk-free rate, and share price.
- DCF Valuation (Unlevered and Levered): Editable Discounted Cash Flow models showing intrinsic value with detailed calculations.
- Financial Statements: Pre-loaded financial statements (annual and quarterly) to support analysis.
- Key Ratios: Includes profitability, leverage, and efficiency ratios for Yalla Group Limited (YALA).
- Dashboard and Charts: Visual summary of valuation outputs and assumptions to analyze results easily.
Disclaimer
All information, articles, and product details provided on this website are for general informational and educational purposes only. We do not claim any ownership over, nor do we intend to infringe upon, any trademarks, copyrights, logos, brand names, or other intellectual property mentioned or depicted on this site. Such intellectual property remains the property of its respective owners, and any references here are made solely for identification or informational purposes, without implying any affiliation, endorsement, or partnership.
We make no representations or warranties, express or implied, regarding the accuracy, completeness, or suitability of any content or products presented. Nothing on this website should be construed as legal, tax, investment, financial, medical, or other professional advice. In addition, no part of this site—including articles or product references—constitutes a solicitation, recommendation, endorsement, advertisement, or offer to buy or sell any securities, franchises, or other financial instruments, particularly in jurisdictions where such activity would be unlawful.
All content is of a general nature and may not address the specific circumstances of any individual or entity. It is not a substitute for professional advice or services. Any actions you take based on the information provided here are strictly at your own risk. You accept full responsibility for any decisions or outcomes arising from your use of this website and agree to release us from any liability in connection with your use of, or reliance upon, the content or products found herein.