
|
Yatra Online, Inc. (YTRA) DCF -Bewertung |
Fully Editable: Tailor To Your Needs In Excel Or Sheets
Professional Design: Trusted, Industry-Standard Templates
Investor-Approved Valuation Models
MAC/PC Compatible, Fully Unlocked
No Expertise Is Needed; Easy To Follow
Yatra Online, Inc. (YTRA) Bundle
Unser YTRA DCF-Taschenrechner entwickelt für die Genauigkeit und ermöglicht es Ihnen, die Bewertung von Yatra Online, Inc. mit realen Finanzdaten zu bewerten und alle wichtigen Parameter für erweiterte Projektionen zu ändern.
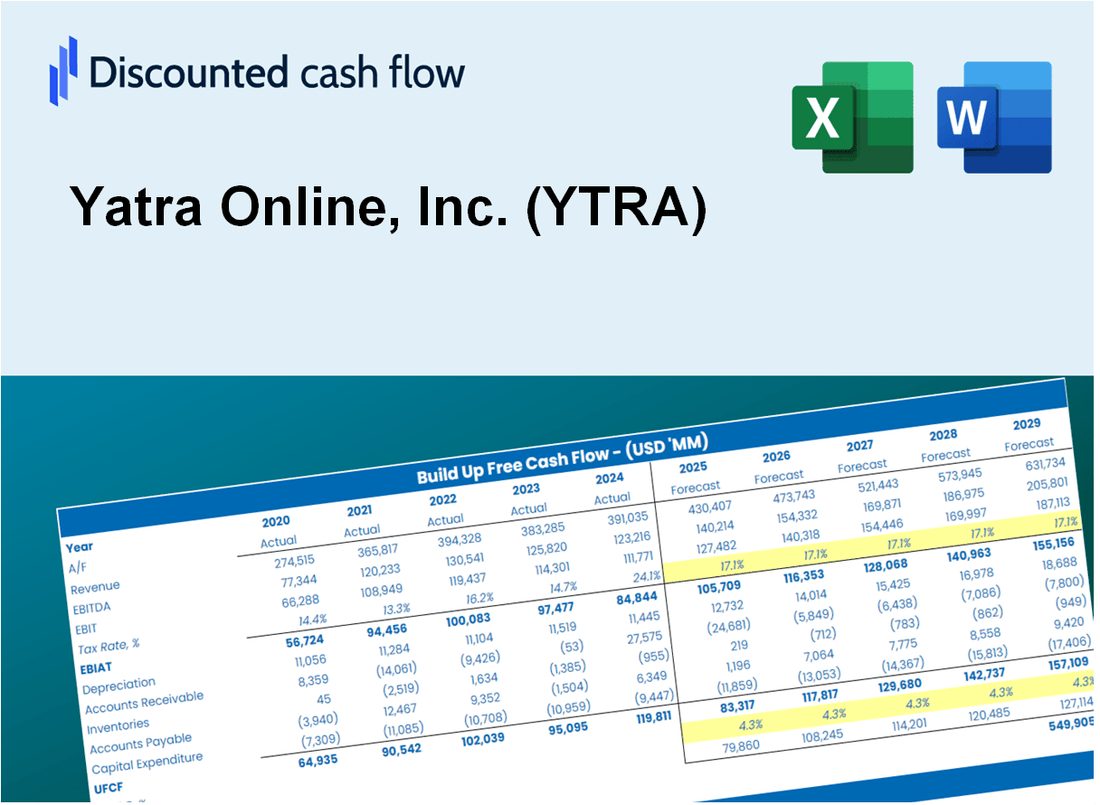
Discounted Cash Flow (DCF) - (USD MM)
| Year | AY1 2021 |
AY2 2022 |
AY3 2023 |
AY4 2024 |
AY5 2025 |
FY1 2026 |
FY2 2027 |
FY3 2028 |
FY4 2029 |
FY5 2030 |
|---|---|---|---|---|---|---|---|---|---|---|
| Revenue | 14.3 | 22.4 | 43.1 | 47.2 | 89.7 | 145.3 | 235.5 | 381.6 | 618.3 | 1,002.0 |
| Revenue Growth, % | 0 | 56.49 | 92.39 | 9.47 | 89.85 | 62.05 | 62.05 | 62.05 | 62.05 | 62.05 |
| EBITDA | -7.5 | .4 | 6.1 | 1.2 | 4.5 | -8.4 | -13.6 | -22.1 | -35.8 | -58.0 |
| EBITDA, % | -52.5 | 1.94 | 14.07 | 2.57 | 4.98 | -5.79 | -5.79 | -5.79 | -5.79 | -5.79 |
| Depreciation | 7.5 | 3.2 | 2.1 | 2.2 | 3.5 | 23.1 | 37.5 | 60.7 | 98.4 | 159.4 |
| Depreciation, % | 52.04 | 14.12 | 4.78 | 4.71 | 3.88 | 15.91 | 15.91 | 15.91 | 15.91 | 15.91 |
| EBIT | -15.0 | -2.7 | 4.0 | -1.0 | 1.0 | -30.2 | -48.9 | -79.3 | -128.5 | -208.3 |
| EBIT, % | -104.53 | -12.18 | 9.3 | -2.15 | 1.1 | -20.79 | -20.79 | -20.79 | -20.79 | -20.79 |
| Total Cash | 21.9 | 13.9 | 12.8 | 49.2 | 21.6 | 91.8 | 148.8 | 241.1 | 390.8 | 633.2 |
| Total Cash, percent | .0 | .0 | .0 | .0 | .0 | .0 | .0 | .0 | .0 | .0 |
| Account Receivables | 8.9 | 21.9 | 38.0 | 50.7 | 68.9 | 123.5 | 200.1 | 324.2 | 525.4 | 851.4 |
| Account Receivables, % | 62.31 | 97.53 | 88.18 | 107.44 | 76.79 | 84.96 | 84.96 | 84.96 | 84.96 | 84.96 |
| Inventories | .0 | -5.0 | .0 | .0 | .0 | -6.5 | -10.5 | -16.9 | -27.5 | -44.5 |
| Inventories, % | 0 | -22.21 | 0.00198575 | 0.00126495 | 0.000678859145 | -4.44 | -4.44 | -4.44 | -4.44 | -4.44 |
| Accounts Payable | 11.3 | 16.6 | 15.6 | 12.9 | 18.9 | 69.0 | 111.9 | 181.3 | 293.8 | 476.0 |
| Accounts Payable, % | 78.92 | 73.98 | 36.19 | 27.37 | 21.09 | 47.51 | 47.51 | 47.51 | 47.51 | 47.51 |
| Capital Expenditure | -.9 | -1.1 | -1.7 | -.2 | -3.3 | -5.6 | -9.1 | -14.8 | -24.0 | -38.9 |
| Capital Expenditure, % | -6.12 | -5.05 | -4.03 | -0.48517 | -3.71 | -3.88 | -3.88 | -3.88 | -3.88 | -3.88 |
| Tax Rate, % | 1103.8 | 1103.8 | 1103.8 | 1103.8 | 1103.8 | 1103.8 | 1103.8 | 1103.8 | 1103.8 | 1103.8 |
| EBITAT | -15.7 | -1.8 | -1.3 | -.1 | -9.9 | -10.9 | -17.6 | -28.5 | -46.2 | -74.9 |
| Depreciation | ||||||||||
| Changes in Account Receivables | ||||||||||
| Changes in Inventories | ||||||||||
| Changes in Accounts Payable | ||||||||||
| Capital Expenditure | ||||||||||
| UFCF | -6.8 | -2.5 | -23.1 | -13.5 | -21.8 | 8.6 | -19.0 | -30.9 | -50.0 | -81.1 |
| WACC, % | 9.27 | 9.1 | 8.77 | 8.84 | 8.77 | 8.95 | 8.95 | 8.95 | 8.95 | 8.95 |
| PV UFCF | ||||||||||
| SUM PV UFCF | -120.3 | |||||||||
| Long Term Growth Rate, % | 2.00 | |||||||||
| Free cash flow (T + 1) | -83 | |||||||||
| Terminal Value | -1,190 | |||||||||
| Present Terminal Value | -775 | |||||||||
| Enterprise Value | -896 | |||||||||
| Net Debt | 2 | |||||||||
| Equity Value | -898 | |||||||||
| Diluted Shares Outstanding, MM | 110 | |||||||||
| Equity Value Per Share | -8.13 |
What You Will Receive
- Pre-Filled Financial Model: Yatra Online’s actual data allows for accurate DCF valuation.
- Comprehensive Forecast Control: Modify revenue growth, margins, WACC, and other essential metrics.
- Real-Time Calculations: Instant updates ensure you see the impact of your adjustments immediately.
- Professional-Grade Template: A polished Excel file crafted for high-quality valuation analysis.
- Adaptable and Reusable: Designed for versatility, enabling repeated use for in-depth forecasts.
Key Features
- Comprehensive DCF Calculator: Features both unlevered and levered DCF valuation models tailored for Yatra Online, Inc. (YTRA).
- WACC Calculator: Ready-to-use Weighted Average Cost of Capital sheet with adjustable parameters for precise calculations.
- Customizable Forecast Assumptions: Easily alter growth projections, capital expenditures, and discount rates to fit your analysis.
- Integrated Financial Ratios: Evaluate profitability, leverage, and efficiency ratios specifically for Yatra Online, Inc. (YTRA).
- Interactive Dashboard and Charts: Visual representations of key valuation metrics facilitate straightforward analysis.
How It Works
- Step 1: Download the Excel file.
- Step 2: Review Yatra Online, Inc.'s pre-filled financial data and forecasts.
- Step 3: Modify key inputs such as revenue growth, WACC, and tax rates (highlighted cells).
- Step 4: Observe the DCF model update in real-time as you adjust your assumptions.
- Step 5: Analyze the results and leverage the findings for your investment strategies.
Why Choose This Calculator for Yatra Online, Inc. (YTRA)?
- Accuracy: Utilizes real Yatra financials to ensure precise data.
- Flexibility: Allows users to easily test and adjust inputs as needed.
- Time-Saving: Eliminate the effort of constructing a DCF model from the ground up.
- Professional-Grade: Crafted with the expertise and usability expected at the CFO level.
- User-Friendly: Intuitive interface suitable for users without extensive financial modeling skills.
Who Should Use This Product?
- Investors: Evaluate Yatra Online's valuation before making investment decisions.
- CFOs and Financial Analysts: Optimize valuation methodologies and assess financial forecasts.
- Startup Founders: Understand the valuation strategies of major players like Yatra Online.
- Consultants: Provide comprehensive valuation analyses for clients in the travel industry.
- Students and Educators: Utilize current market data to learn and teach valuation principles.
What the Template Contains
- Preloaded YTRA Data: Historical and projected financial data, including revenue, EBIT, and capital expenditures.
- DCF and WACC Models: Professional-grade sheets for calculating intrinsic value and Weighted Average Cost of Capital.
- Editable Inputs: Yellow-highlighted cells for adjusting revenue growth, tax rates, and discount rates.
- Financial Statements: Comprehensive annual and quarterly financials for deeper analysis.
- Key Ratios: Profitability, leverage, and efficiency ratios to evaluate performance.
- Dashboard and Charts: Visual summaries of valuation outcomes and assumptions.
Disclaimer
All information, articles, and product details provided on this website are for general informational and educational purposes only. We do not claim any ownership over, nor do we intend to infringe upon, any trademarks, copyrights, logos, brand names, or other intellectual property mentioned or depicted on this site. Such intellectual property remains the property of its respective owners, and any references here are made solely for identification or informational purposes, without implying any affiliation, endorsement, or partnership.
We make no representations or warranties, express or implied, regarding the accuracy, completeness, or suitability of any content or products presented. Nothing on this website should be construed as legal, tax, investment, financial, medical, or other professional advice. In addition, no part of this site—including articles or product references—constitutes a solicitation, recommendation, endorsement, advertisement, or offer to buy or sell any securities, franchises, or other financial instruments, particularly in jurisdictions where such activity would be unlawful.
All content is of a general nature and may not address the specific circumstances of any individual or entity. It is not a substitute for professional advice or services. Any actions you take based on the information provided here are strictly at your own risk. You accept full responsibility for any decisions or outcomes arising from your use of this website and agree to release us from any liability in connection with your use of, or reliance upon, the content or products found herein.