
|
Zee Entertainment Enterprises Limited (Zeel.NS) DCF -Bewertung |
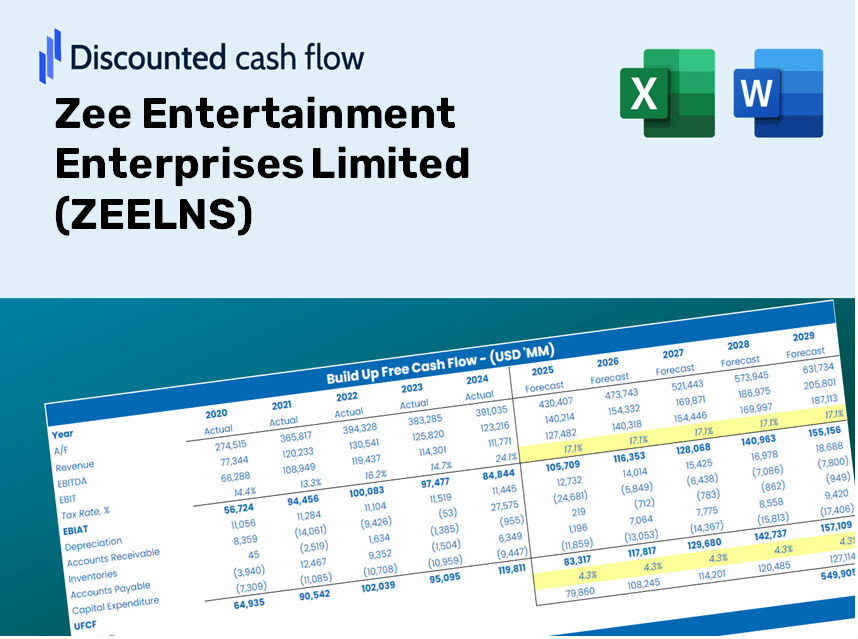
Fully Editable: Tailor To Your Needs In Excel Or Sheets
Professional Design: Trusted, Industry-Standard Templates
Investor-Approved Valuation Models
MAC/PC Compatible, Fully Unlocked
No Expertise Is Needed; Easy To Follow
Zee Entertainment Enterprises Limited (ZEEL.NS) Bundle
Unser (Zeelns) DCF-Taschenrechner entwickelt für die Genauigkeit und ermöglicht es Ihnen, die Bewertung von Zee Entertainment Enterprises, begrenzt mit realen Finanzdaten, zu bewerten und gleichzeitig vollständige Flexibilität zu bieten, um alle wesentlichen Parameter für verbesserte Projektionen zu ändern.
Discounted Cash Flow (DCF) - (USD MM)
| Year | AY1 2021 |
AY2 2022 |
AY3 2023 |
AY4 2024 |
AY5 2025 |
FY1 2026 |
FY2 2027 |
FY3 2028 |
FY4 2029 |
FY5 2030 |
|---|---|---|---|---|---|---|---|---|---|---|
| Revenue | 77,299.0 | 81,834.0 | 80,879.0 | 86,372.0 | 82,941.0 | 84,500.1 | 86,088.5 | 87,706.8 | 89,355.5 | 91,035.2 |
| Revenue Growth, % | 0 | 5.87 | -1.17 | 6.79 | -3.97 | 1.88 | 1.88 | 1.88 | 1.88 | 1.88 |
| EBITDA | 15,767.0 | 17,871.0 | 8,501.0 | 7,699.0 | 12,373.0 | 12,941.7 | 13,185.0 | 13,432.8 | 13,685.3 | 13,942.6 |
| EBITDA, % | 20.4 | 21.84 | 10.51 | 8.91 | 14.92 | 15.32 | 15.32 | 15.32 | 15.32 | 15.32 |
| Depreciation | 2,639.0 | 2,449.0 | 3,117.0 | 3,167.0 | 2,785.0 | 2,921.2 | 2,976.1 | 3,032.0 | 3,089.0 | 3,147.1 |
| Depreciation, % | 3.41 | 2.99 | 3.85 | 3.67 | 3.36 | 3.46 | 3.46 | 3.46 | 3.46 | 3.46 |
| EBIT | 13,128.0 | 15,422.0 | 5,384.0 | 4,532.0 | 9,588.0 | 10,020.5 | 10,208.9 | 10,400.8 | 10,596.3 | 10,795.5 |
| EBIT, % | 16.98 | 18.85 | 6.66 | 5.25 | 11.56 | 11.86 | 11.86 | 11.86 | 11.86 | 11.86 |
| Total Cash | 18,152.0 | 12,922.0 | 11,674.0 | 11,932.0 | 27,469.0 | 17,008.3 | 17,328.0 | 17,653.7 | 17,985.6 | 18,323.7 |
| Total Cash, percent | .0 | .0 | .0 | .0 | .0 | .0 | .0 | .0 | .0 | .0 |
| Account Receivables | 22,306.0 | 21,717.0 | 19,610.0 | 20,481.0 | 15,325.0 | 20,589.3 | 20,976.4 | 21,370.7 | 21,772.4 | 22,181.7 |
| Account Receivables, % | 28.86 | 26.54 | 24.25 | 23.71 | 18.48 | 24.37 | 24.37 | 24.37 | 24.37 | 24.37 |
| Inventories | 54,030.0 | 63,862.0 | 73,078.9 | 69,129.0 | 67,748.0 | 67,601.8 | 68,872.6 | 70,167.2 | 71,486.2 | 72,830.0 |
| Inventories, % | 69.9 | 78.04 | 90.36 | 80.04 | 81.68 | 80 | 80 | 80 | 80 | 80 |
| Accounts Payable | 13,982.0 | 13,719.0 | 17,494.0 | 14,356.0 | 11,907.0 | 14,780.7 | 15,058.5 | 15,341.6 | 15,630.0 | 15,923.8 |
| Accounts Payable, % | 18.09 | 16.76 | 21.63 | 16.62 | 14.36 | 17.49 | 17.49 | 17.49 | 17.49 | 17.49 |
| Capital Expenditure | -2,060.0 | -2,361.0 | -2,676.4 | -1,305.0 | -916.0 | -1,939.2 | -1,975.7 | -2,012.8 | -2,050.6 | -2,089.2 |
| Capital Expenditure, % | -2.66 | -2.89 | -3.31 | -1.51 | -1.1 | -2.29 | -2.29 | -2.29 | -2.29 | -2.29 |
| Tax Rate, % | 26.63 | 26.63 | 26.63 | 26.63 | 26.63 | 26.63 | 26.63 | 26.63 | 26.63 | 26.63 |
| EBITAT | 8,365.5 | 9,927.3 | 549.7 | 1,681.5 | 7,034.9 | 4,985.8 | 5,079.5 | 5,175.0 | 5,272.3 | 5,371.4 |
| Depreciation | ||||||||||
| Changes in Account Receivables | ||||||||||
| Changes in Inventories | ||||||||||
| Changes in Accounts Payable | ||||||||||
| Capital Expenditure | ||||||||||
| UFCF | -53,409.5 | 509.3 | -2,344.6 | 3,484.4 | 12,991.9 | 3,723.3 | 4,700.0 | 4,788.3 | 4,878.3 | 4,970.0 |
| WACC, % | 5.31 | 5.31 | 5.13 | 5.22 | 5.34 | 5.26 | 5.26 | 5.26 | 5.26 | 5.26 |
| PV UFCF | ||||||||||
| SUM PV UFCF | 19,704.5 | |||||||||
| Long Term Growth Rate, % | 4.00 | |||||||||
| Free cash flow (T + 1) | 5,169 | |||||||||
| Terminal Value | 409,822 | |||||||||
| Present Terminal Value | 317,142 | |||||||||
| Enterprise Value | 336,846 | |||||||||
| Net Debt | -3,995 | |||||||||
| Equity Value | 340,841 | |||||||||
| Diluted Shares Outstanding, MM | 961 | |||||||||
| Equity Value Per Share | 354.85 |
What You Will Receive
- Customizable Excel Template: A fully adaptable DCF Calculator in Excel, complete with pre-populated financials for ZEELNS (Zee Entertainment Enterprises Limited).
- Actual Financial Data: Access to historical data and forward-looking projections (highlighted in the designated yellow cells).
- Adaptable Forecasting: Modify key assumptions such as revenue growth, EBITDA percentage, and WACC to suit your analysis.
- Instant Calculations: Quickly observe how your inputs affect the valuation of ZEELNS (Zee Entertainment Enterprises Limited).
- Professional-Grade Toolkit: Designed for use by investors, CFOs, consultants, and financial analysts alike.
- Intuitive Interface: Organized for straightforward navigation, accompanied by step-by-step guidance for ease of understanding.
Key Features
- Pre-Loaded Data: ZEELNS’s historical financial statements and pre-filled forecasts.
- Fully Adjustable Inputs: Customize WACC, tax rates, revenue growth, and EBITDA margins.
- Instant Results: Watch ZEELNS’s intrinsic value update in real time.
- Clear Visual Outputs: Dashboard charts present valuation results and essential metrics.
- Built for Accuracy: A professional tool designed for analysts, investors, and finance professionals.
How It Works
- Download: Get the pre-prepared Excel file containing Zee Entertainment Enterprises Limited's (ZEELNS) financial data.
- Customize: Tailor your forecasts, such as revenue growth, EBITDA percentage, and WACC.
- Update Automatically: Watch as intrinsic value and NPV calculations refresh in real-time.
- Test Scenarios: Generate various projections and instantly compare the results.
- Make Decisions: Leverage the valuation insights to inform your investment strategy.
Why Select This Calculator for Zee Entertainment Enterprises Limited (ZEELNS)?
- All-in-One Resource: Combines DCF, WACC, and financial ratio analyses into a single tool.
- Flexible Inputs: Modify the yellow-highlighted fields to explore different scenarios.
- In-Depth Analysis: Automatically evaluates Zee Entertainment's intrinsic value and Net Present Value.
- Preloaded Information: Historical and projected data provide reliable starting points for your calculations.
- Professional Standard: Perfectly suited for financial analysts, investors, and business consultants.
Who Can Benefit from This Product?
- Finance Students: Master valuation techniques and apply them using real-world data.
- Academics: Integrate industry-standard models into your courses or research projects.
- Investors: Evaluate your own assumptions and assess valuation outcomes for Zee Entertainment Enterprises Limited (ZEELNS).
- Analysts: Enhance your efficiency with a customizable, ready-to-use DCF model.
- Small Business Owners: Understand how large public companies like Zee Entertainment Enterprises Limited (ZEELNS) are evaluated.
Contents of the Template
- Detailed DCF Model: An editable template featuring extensive valuation calculations.
- Actual Financial Data: Historical and projected financial figures for Zee Entertainment Enterprises Limited (ZEELNS) already included for analysis.
- Adjustable Variables: Modify WACC, growth rates, and tax assumptions to explore different scenarios.
- Financial Statements: Comprehensive annual and quarterly reports for in-depth understanding.
- Key Performance Metrics: Integrated analysis of profitability, efficiency, and leverage ratios.
- Dashboard with Visual Representations: Visuals and tables for clear, actionable insights.
Disclaimer
All information, articles, and product details provided on this website are for general informational and educational purposes only. We do not claim any ownership over, nor do we intend to infringe upon, any trademarks, copyrights, logos, brand names, or other intellectual property mentioned or depicted on this site. Such intellectual property remains the property of its respective owners, and any references here are made solely for identification or informational purposes, without implying any affiliation, endorsement, or partnership.
We make no representations or warranties, express or implied, regarding the accuracy, completeness, or suitability of any content or products presented. Nothing on this website should be construed as legal, tax, investment, financial, medical, or other professional advice. In addition, no part of this site—including articles or product references—constitutes a solicitation, recommendation, endorsement, advertisement, or offer to buy or sell any securities, franchises, or other financial instruments, particularly in jurisdictions where such activity would be unlawful.
All content is of a general nature and may not address the specific circumstances of any individual or entity. It is not a substitute for professional advice or services. Any actions you take based on the information provided here are strictly at your own risk. You accept full responsibility for any decisions or outcomes arising from your use of this website and agree to release us from any liability in connection with your use of, or reliance upon, the content or products found herein.