
|
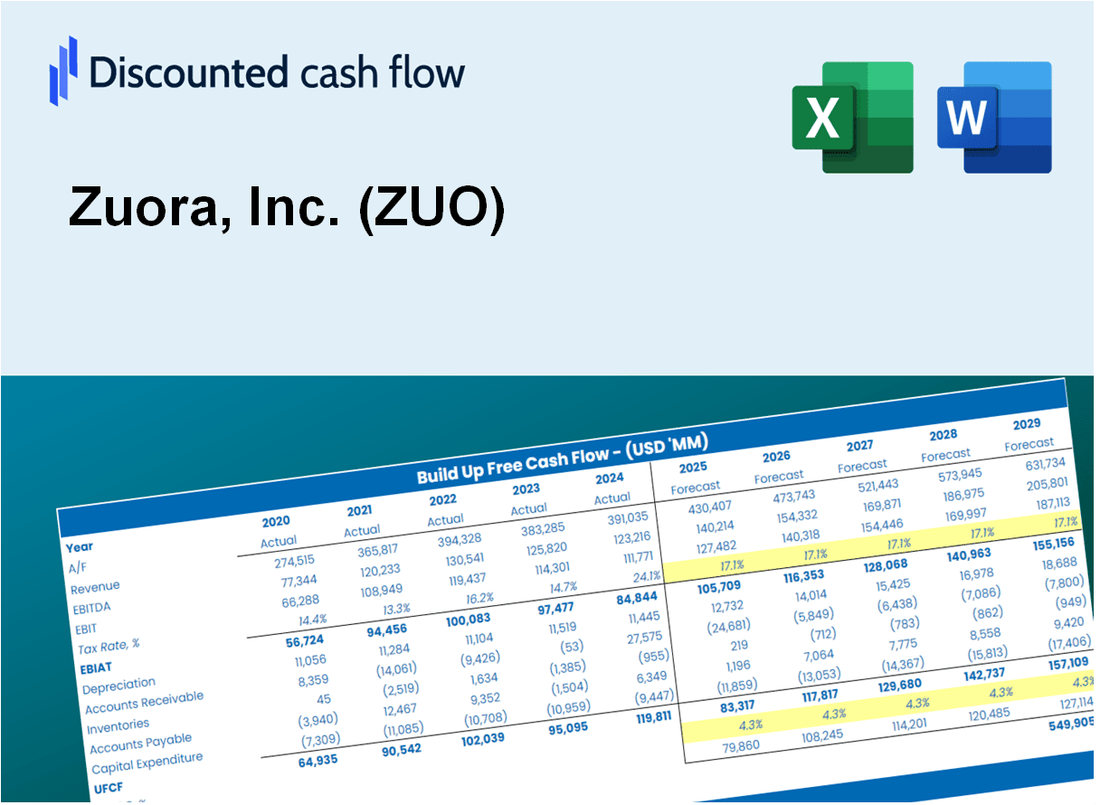
Zuora, Inc. (Zuo) DCF -Bewertung |
Fully Editable: Tailor To Your Needs In Excel Or Sheets
Professional Design: Trusted, Industry-Standard Templates
Investor-Approved Valuation Models
MAC/PC Compatible, Fully Unlocked
No Expertise Is Needed; Easy To Follow
Zuora, Inc. (ZUO) Bundle
Bewerten Sie die finanzielle Aussichten von Zuora, Inc. (Zuo) wie ein Experte! Dieser (Zuo) DCF-Taschenrechner bietet vorgefüllte Finanzdaten und bietet gleichzeitig vollständige Flexibilität, um das Umsatzwachstum, WACC, Margen und andere wichtige Annahmen zu ändern, um sich mit Ihren Vorhersagen auszurichten.
Discounted Cash Flow (DCF) - (USD MM)
| Year | AY1 2020 |
AY2 2021 |
AY3 2022 |
AY4 2023 |
AY5 2024 |
FY1 2025 |
FY2 2026 |
FY3 2027 |
FY4 2028 |
FY5 2029 |
|---|---|---|---|---|---|---|---|---|---|---|
| Revenue | 276.1 | 305.4 | 346.7 | 396.1 | 431.7 | 482.8 | 540.0 | 603.9 | 675.5 | 755.5 |
| Revenue Growth, % | 0 | 10.64 | 13.53 | 14.23 | 8.98 | 11.84 | 11.84 | 11.84 | 11.84 | 11.84 |
| EBITDA | -73.8 | -58.6 | -71.5 | -146.2 | -26.3 | -105.8 | -118.3 | -132.3 | -148.0 | -165.5 |
| EBITDA, % | -26.73 | -19.17 | -20.63 | -36.9 | -6.1 | -21.91 | -21.91 | -21.91 | -21.91 | -21.91 |
| Depreciation | 20.5 | 23.6 | 26.5 | 26.1 | 18.2 | 32.4 | 36.3 | 40.5 | 45.4 | 50.7 |
| Depreciation, % | 7.41 | 7.72 | 7.64 | 6.59 | 4.22 | 6.71 | 6.71 | 6.71 | 6.71 | 6.71 |
| EBIT | -94.2 | -82.1 | -98.0 | -172.3 | -44.6 | -138.2 | -154.5 | -172.9 | -193.3 | -216.2 |
| EBIT, % | -34.14 | -26.89 | -28.26 | -43.49 | -10.32 | -28.62 | -28.62 | -28.62 | -28.62 | -28.62 |
| Total Cash | 171.9 | 186.6 | 215.4 | 386.2 | 514.9 | 369.8 | 413.6 | 462.6 | 517.4 | 578.7 |
| Total Cash, percent | .0 | .0 | .0 | .0 | .0 | .0 | .0 | .0 | .0 | .0 |
| Account Receivables | 71.4 | 80.2 | 84.8 | 98.9 | 126.0 | 126.2 | 141.2 | 157.9 | 176.6 | 197.5 |
| Account Receivables, % | 25.85 | 26.27 | 24.46 | 24.98 | 29.19 | 26.15 | 26.15 | 26.15 | 26.15 | 26.15 |
| Inventories | 9.6 | 12.7 | 28.5 | 16.3 | .0 | 19.3 | 21.6 | 24.1 | 27.0 | 30.2 |
| Inventories, % | 3.47 | 4.16 | 8.21 | 4.11 | 0 | 3.99 | 3.99 | 3.99 | 3.99 | 3.99 |
| Accounts Payable | 2.1 | 2.2 | 6.8 | 1.1 | 3.2 | 4.3 | 4.8 | 5.4 | 6.0 | 6.7 |
| Accounts Payable, % | 0.75999 | 0.73636 | 1.96 | 0.2709 | 0.73229 | 0.89127 | 0.89127 | 0.89127 | 0.89127 | 0.89127 |
| Capital Expenditure | -21.4 | -13.1 | -10.1 | -10.6 | -10.0 | -19.3 | -21.6 | -24.1 | -27.0 | -30.2 |
| Capital Expenditure, % | -7.76 | -4.3 | -2.92 | -2.68 | -2.31 | -4 | -4 | -4 | -4 | -4 |
| Tax Rate, % | -3.26 | -3.26 | -3.26 | -3.26 | -3.26 | -3.26 | -3.26 | -3.26 | -3.26 | -3.26 |
| EBITAT | -94.8 | -84.3 | -99.4 | -188.6 | -46.0 | -138.2 | -154.5 | -172.9 | -193.3 | -216.2 |
| Depreciation | ||||||||||
| Changes in Account Receivables | ||||||||||
| Changes in Inventories | ||||||||||
| Changes in Accounts Payable | ||||||||||
| Capital Expenditure | ||||||||||
| UFCF | -174.6 | -85.7 | -98.9 | -180.8 | -46.5 | -143.4 | -156.6 | -175.1 | -195.9 | -219.1 |
| WACC, % | 10.67 | 10.67 | 10.67 | 10.67 | 10.67 | 10.67 | 10.67 | 10.67 | 10.67 | 10.67 |
| PV UFCF | ||||||||||
| SUM PV UFCF | -649.2 | |||||||||
| Long Term Growth Rate, % | 2.00 | |||||||||
| Free cash flow (T + 1) | -223 | |||||||||
| Terminal Value | -2,577 | |||||||||
| Present Terminal Value | -1,552 | |||||||||
| Enterprise Value | -2,201 | |||||||||
| Net Debt | 147 | |||||||||
| Equity Value | -2,349 | |||||||||
| Diluted Shares Outstanding, MM | 140 | |||||||||
| Equity Value Per Share | -16.76 |
What You Will Get
- Comprehensive Financial Model: Zuora’s actual data allows for accurate DCF valuation.
- Complete Forecast Flexibility: Modify revenue growth, margins, WACC, and other critical factors.
- Real-Time Calculations: Instant updates ensure you see outcomes as you make adjustments.
- Professional-Grade Template: A polished Excel file crafted for high-quality valuation.
- Adaptable and Reusable: Designed for versatility, enabling repeated use for in-depth forecasts.
Key Features
- Comprehensive Subscription Management: Streamlined processes for billing, invoicing, and revenue recognition.
- Revenue Forecasting Tools: Powerful models to predict subscription revenue growth and trends.
- Customizable Analytics Dashboard: Tailor insights on customer engagement and churn rates.
- Integration Capabilities: Seamless connections with major CRM and ERP systems for enhanced data flow.
- Robust Reporting Features: Generate detailed reports on financial performance and customer metrics.
How It Works
- Step 1: Download the Excel file for Zuora, Inc. (ZUO).
- Step 2: Review Zuora’s pre-filled financial data and forecasts.
- Step 3: Modify key inputs such as subscription growth, customer acquisition costs, and churn rates (highlighted cells).
- Step 4: Observe the DCF model update in real-time as you adjust your assumptions.
- Step 5: Analyze the outputs and leverage the results for your investment strategies.
Why Choose This Calculator for Zuora, Inc. (ZUO)?
- User-Friendly Interface: Perfectly suited for both novices and seasoned professionals.
- Customizable Inputs: Adjust parameters to suit your specific financial analysis.
- Real-Time Valuation Updates: Monitor immediate changes to Zuora’s valuation as you tweak the inputs.
- Preconfigured Data: Comes with Zuora’s latest financial metrics for efficient evaluation.
- Relied Upon by Experts: Favored by investors and analysts for making well-informed choices.
Who Should Use This Product?
- Subscription Business Owners: Optimize pricing strategies and improve customer retention for their services.
- Financial Analysts: Enhance forecasting accuracy with comprehensive subscription revenue models.
- Consultants: Provide valuable insights on subscription-based business models to clients efficiently.
- Investors: Make informed decisions about investing in Zuora, Inc. (ZUO) based on market trends and data.
- Business Students: Gain practical knowledge of subscription economics and SaaS business strategies.
What the Template Contains
- Operating and Balance Sheet Data: Pre-filled Zuora historical data and forecasts, including revenue, EBITDA, EBIT, and capital expenditures.
- WACC Calculation: A dedicated sheet for Weighted Average Cost of Capital (WACC), including parameters like Beta, risk-free rate, and share price.
- DCF Valuation (Unlevered and Levered): Editable Discounted Cash Flow models showing intrinsic value with detailed calculations.
- Financial Statements: Pre-loaded financial statements (annual and quarterly) to support analysis.
- Key Ratios: Includes profitability, leverage, and efficiency ratios for Zuora, Inc. (ZUO).
- Dashboard and Charts: Visual summary of valuation outputs and assumptions to analyze results easily.
Disclaimer
All information, articles, and product details provided on this website are for general informational and educational purposes only. We do not claim any ownership over, nor do we intend to infringe upon, any trademarks, copyrights, logos, brand names, or other intellectual property mentioned or depicted on this site. Such intellectual property remains the property of its respective owners, and any references here are made solely for identification or informational purposes, without implying any affiliation, endorsement, or partnership.
We make no representations or warranties, express or implied, regarding the accuracy, completeness, or suitability of any content or products presented. Nothing on this website should be construed as legal, tax, investment, financial, medical, or other professional advice. In addition, no part of this site—including articles or product references—constitutes a solicitation, recommendation, endorsement, advertisement, or offer to buy or sell any securities, franchises, or other financial instruments, particularly in jurisdictions where such activity would be unlawful.
All content is of a general nature and may not address the specific circumstances of any individual or entity. It is not a substitute for professional advice or services. Any actions you take based on the information provided here are strictly at your own risk. You accept full responsibility for any decisions or outcomes arising from your use of this website and agree to release us from any liability in connection with your use of, or reliance upon, the content or products found herein.