
|
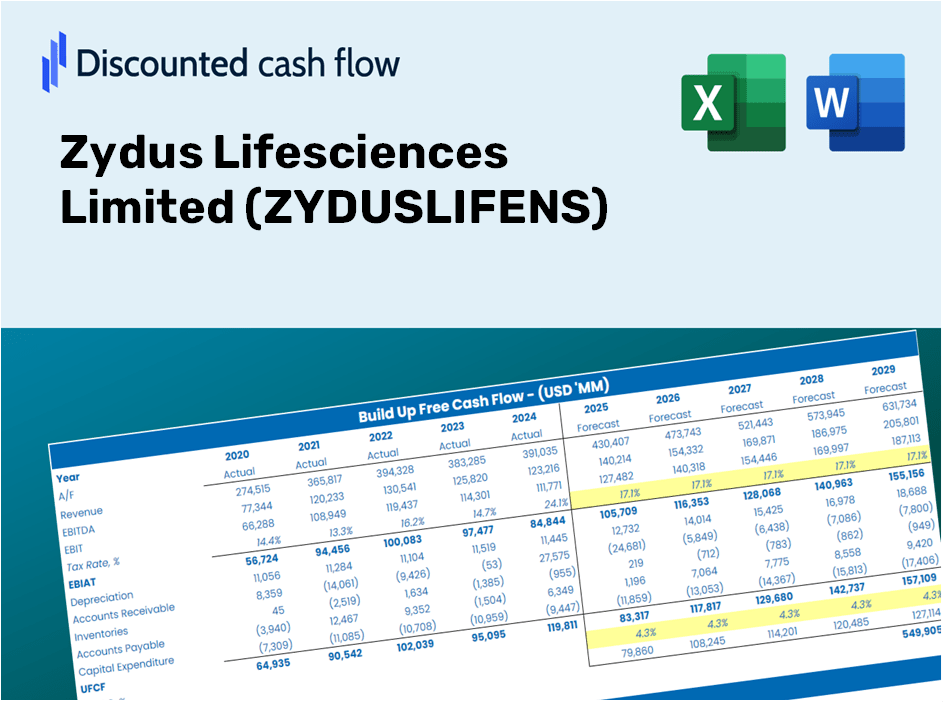
Zydus Lifesciences Limited (ZydusLife.NS) DCF -Bewertung |
Fully Editable: Tailor To Your Needs In Excel Or Sheets
Professional Design: Trusted, Industry-Standard Templates
Investor-Approved Valuation Models
MAC/PC Compatible, Fully Unlocked
No Expertise Is Needed; Easy To Follow
Zydus Lifesciences Limited (ZYDUSLIFE.NS) Bundle
Entdecken Sie die finanziellen Aussichten von Zydus Lifesciences Limited (Zyduslifens) mit unserem benutzerfreundlichen DCF-Taschenrechner! Geben Sie Ihre Projektionen für Wachstum, Margen und Kosten ein, um den inneren Wert von Zydus Lifesciences Limited (Zyduslifens) zu bestimmen und Ihren Investitionsansatz zu verfeinern.
Discounted Cash Flow (DCF) - (USD MM)
| Year | AY1 2021 |
AY2 2022 |
AY3 2023 |
AY4 2024 |
AY5 2025 |
FY1 2026 |
FY2 2027 |
FY3 2028 |
FY4 2029 |
FY5 2030 |
|---|---|---|---|---|---|---|---|---|---|---|
| Revenue | 144,035.0 | 151,099.0 | 172,374.0 | 195,474.0 | 232,415.0 | 262,212.8 | 295,831.0 | 333,759.3 | 376,550.4 | 424,827.8 |
| Revenue Growth, % | 0 | 4.9 | 14.08 | 13.4 | 18.9 | 12.82 | 12.82 | 12.82 | 12.82 | 12.82 |
| EBITDA | 34,152.0 | 31,695.0 | 35,344.0 | 52,572.0 | 68,303.0 | 63,704.3 | 71,871.8 | 81,086.5 | 91,482.5 | 103,211.5 |
| EBITDA, % | 23.71 | 20.98 | 20.5 | 26.89 | 29.39 | 24.29 | 24.29 | 24.29 | 24.29 | 24.29 |
| Depreciation | 6,796.0 | 6,954.0 | 6,816.0 | 7,180.0 | 8,701.0 | 10,851.2 | 12,242.4 | 13,812.0 | 15,582.9 | 17,580.8 |
| Depreciation, % | 4.72 | 4.6 | 3.95 | 3.67 | 3.74 | 4.14 | 4.14 | 4.14 | 4.14 | 4.14 |
| EBIT | 27,356.0 | 24,741.0 | 28,528.0 | 45,392.0 | 59,602.0 | 52,853.1 | 59,629.4 | 67,274.4 | 75,899.6 | 85,630.7 |
| EBIT, % | 18.99 | 16.37 | 16.55 | 23.22 | 25.64 | 20.16 | 20.16 | 20.16 | 20.16 | 20.16 |
| Total Cash | 11,272.0 | 35,048.0 | 11,924.0 | 13,576.0 | 78,079.0 | 41,156.2 | 46,432.8 | 52,385.9 | 59,102.3 | 66,679.8 |
| Total Cash, percent | .0 | .0 | .0 | .0 | .0 | .0 | .0 | .0 | .0 | .0 |
| Account Receivables | 34,453.0 | 34,933.0 | 46,353.0 | 54,860.0 | 45,846.0 | 63,833.7 | 72,017.8 | 81,251.1 | 91,668.3 | 103,421.0 |
| Account Receivables, % | 23.92 | 23.12 | 26.89 | 28.07 | 19.73 | 24.34 | 24.34 | 24.34 | 24.34 | 24.34 |
| Inventories | 32,362.0 | 37,194.0 | 34,133.0 | 34,419.0 | 39,440.0 | 53,209.9 | 60,031.9 | 67,728.5 | 76,412.0 | 86,208.7 |
| Inventories, % | 22.47 | 24.62 | 19.8 | 17.61 | 16.97 | 20.29 | 20.29 | 20.29 | 20.29 | 20.29 |
| Accounts Payable | 22,059.0 | 21,378.0 | 21,250.0 | 21,267.0 | 23,058.0 | 32,824.8 | 37,033.3 | 41,781.3 | 47,138.1 | 53,181.6 |
| Accounts Payable, % | 15.32 | 14.15 | 12.33 | 10.88 | 9.92 | 12.52 | 12.52 | 12.52 | 12.52 | 12.52 |
| Capital Expenditure | -8,540.0 | -12,026.0 | -10,309.0 | -9,066.0 | -17,126.0 | -16,716.3 | -18,859.5 | -21,277.4 | -24,005.4 | -27,083.1 |
| Capital Expenditure, % | -5.93 | -7.96 | -5.98 | -4.64 | -7.37 | -6.38 | -6.38 | -6.38 | -6.38 | -6.38 |
| Tax Rate, % | 25.62 | 25.62 | 25.62 | 25.62 | 25.62 | 25.62 | 25.62 | 25.62 | 25.62 | 25.62 |
| EBITAT | 23,856.3 | 38,491.2 | 20,833.5 | 35,555.1 | 44,330.5 | 43,650.5 | 49,246.9 | 55,560.8 | 62,684.2 | 70,720.9 |
| Depreciation | ||||||||||
| Changes in Account Receivables | ||||||||||
| Changes in Inventories | ||||||||||
| Changes in Accounts Payable | ||||||||||
| Capital Expenditure | ||||||||||
| UFCF | -22,643.7 | 27,426.2 | 8,853.5 | 24,893.1 | 41,689.5 | 15,794.7 | 31,832.2 | 35,913.4 | 40,517.9 | 45,712.6 |
| WACC, % | 5.64 | 5.65 | 5.62 | 5.63 | 5.62 | 5.63 | 5.63 | 5.63 | 5.63 | 5.63 |
| PV UFCF | ||||||||||
| SUM PV UFCF | 141,257.7 | |||||||||
| Long Term Growth Rate, % | 4.00 | |||||||||
| Free cash flow (T + 1) | 47,541 | |||||||||
| Terminal Value | 2,915,119 | |||||||||
| Present Terminal Value | 2,216,677 | |||||||||
| Enterprise Value | 2,357,935 | |||||||||
| Net Debt | 2,564 | |||||||||
| Equity Value | 2,355,371 | |||||||||
| Diluted Shares Outstanding, MM | 1,006 | |||||||||
| Equity Value Per Share | 2,340.54 |
What You Will Receive
- Authentic Zydus Data: Preloaded financial metrics – including revenue and EBIT – derived from actual and projected figures.
- Comprehensive Customization: Modify all essential parameters (yellow cells) such as WACC, growth %, and tax rates.
- Real-Time Valuation Updates: Automatic recalculations to assess the impact of changes on Zydus Lifesciences' fair value.
- User-Friendly Excel Template: Designed for quick modifications, scenario analysis, and in-depth projections.
- Efficient and Reliable: Eliminate the need to build models from the ground up while ensuring accuracy and adaptability.
Key Features
- Customizable Forecast Inputs: Adjust essential parameters such as revenue growth, EBITDA %, and capital expenditures to fit your analysis.
- Instant DCF Valuation: Automatically computes intrinsic value, NPV, and other financial metrics with ease.
- High-Precision Accuracy: Leverages Zydus Lifesciences Limited's real-world financial data for dependable valuation results.
- Simplified Scenario Analysis: Effortlessly examine various assumptions and assess different outcomes.
- Efficiency Boosting Tool: Say goodbye to the complexities of building intricate valuation models from the ground up.
How It Works
- Step 1: Download the Excel file.
- Step 2: Review the pre-populated data for Zydus Lifesciences Limited (ZYDUSLIFENS), including historical and projected figures.
- Step 3: Modify the key assumptions (highlighted in yellow) based on your analysis.
- Step 4: Observe the automatic recalculations reflecting Zydus Lifesciences’ intrinsic value.
- Step 5: Utilize the results for investment decisions or reporting purposes.
Why Opt for This Calculator?
- User-Friendly and Accessible: Crafted for both novices and experienced users.
- Customizable Inputs: Easily adjust assumptions to suit your analysis needs.
- Real-Time Updates: Observe immediate changes to Zydus Lifesciences Limited's valuation as you modify inputs.
- Preconfigured Data: Comes with Zydus Lifesciences Limited's actual financial information for swift evaluations.
- Relied Upon by Experts: Employed by investors and analysts for making well-informed choices.
Who Can Benefit from Zydus Lifesciences Limited (ZYDUSLIFENS)?
- Investors: Make informed investment choices with our comprehensive analysis tools.
- Financial Analysts: Save valuable time using our customized financial models tailored for the healthcare sector.
- Consultants: Effortlessly modify our templates for client engagements, presentations, or reports.
- Healthcare Enthusiasts: Enhance your knowledge of the life sciences industry through practical case studies.
- Educators and Students: Utilize our resources as an effective learning tool in finance and healthcare courses.
Contents of the Template
- Operating and Balance Sheet Data: Pre-filled historical data and forecasts for Zydus Lifesciences Limited (ZYDUSLIFENS), including metrics such as revenue, EBITDA, EBIT, and capital expenditures.
- WACC Calculation: A specific sheet for calculating the Weighted Average Cost of Capital (WACC), featuring inputs like Beta, risk-free rate, and share price.
- DCF Valuation (Unlevered and Levered): Customizable Discounted Cash Flow models that provide intrinsic value alongside detailed calculations.
- Financial Statements: Pre-loaded annual and quarterly financial statements to facilitate thorough analysis.
- Key Ratios: A collection of key ratios for Zydus Lifesciences Limited (ZYDUSLIFENS), covering profitability, leverage, and efficiency metrics.
- Dashboard and Charts: A visual overview of valuation outputs and underlying assumptions to simplify result analysis.
Disclaimer
All information, articles, and product details provided on this website are for general informational and educational purposes only. We do not claim any ownership over, nor do we intend to infringe upon, any trademarks, copyrights, logos, brand names, or other intellectual property mentioned or depicted on this site. Such intellectual property remains the property of its respective owners, and any references here are made solely for identification or informational purposes, without implying any affiliation, endorsement, or partnership.
We make no representations or warranties, express or implied, regarding the accuracy, completeness, or suitability of any content or products presented. Nothing on this website should be construed as legal, tax, investment, financial, medical, or other professional advice. In addition, no part of this site—including articles or product references—constitutes a solicitation, recommendation, endorsement, advertisement, or offer to buy or sell any securities, franchises, or other financial instruments, particularly in jurisdictions where such activity would be unlawful.
All content is of a general nature and may not address the specific circumstances of any individual or entity. It is not a substitute for professional advice or services. Any actions you take based on the information provided here are strictly at your own risk. You accept full responsibility for any decisions or outcomes arising from your use of this website and agree to release us from any liability in connection with your use of, or reliance upon, the content or products found herein.