
|
Shenzhen Zhenye Co., Ltd. (000006.sz) valoración de DCF |
Completamente Editable: Adáptelo A Sus Necesidades En Excel O Sheets
Diseño Profesional: Plantillas Confiables Y Estándares De La Industria
Predeterminadas Para Un Uso Rápido Y Eficiente
Compatible con MAC / PC, completamente desbloqueado
No Se Necesita Experiencia; Fáciles De Seguir
Shenzhen Zhenye (Group) Co.,Ltd. (000006.SZ) Bundle
Ya sea que sea un inversionista o analista, esta calculadora DCF (000006SZ) es su recurso para una valoración precisa. Cargados con datos reales de Shenzhen Zhenye (Group) Co., Ltd., puede ajustar los pronósticos y observar instantáneamente los efectos.
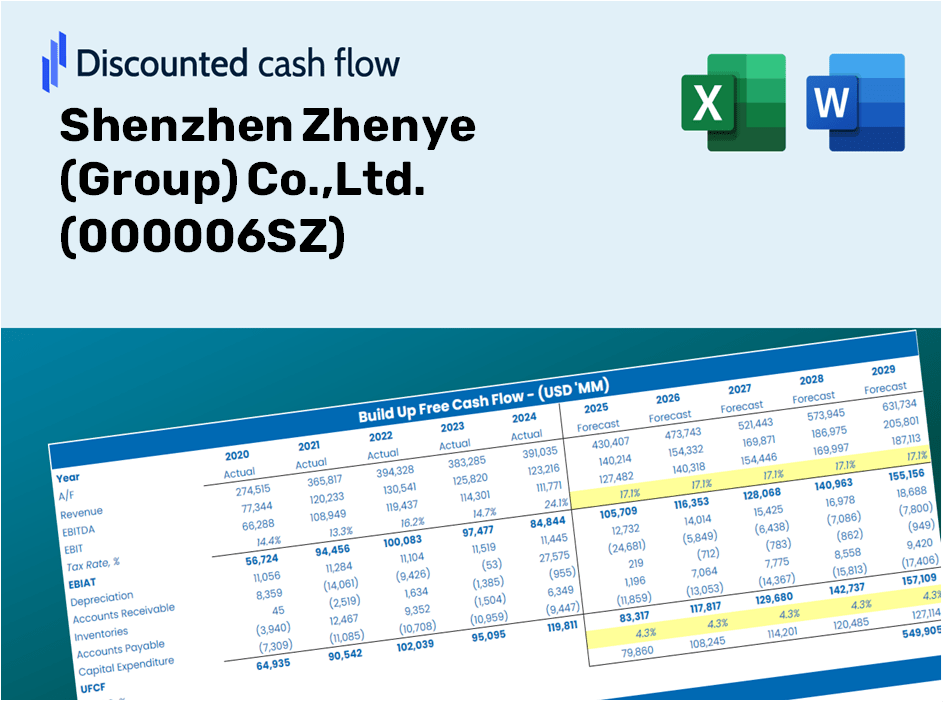
Discounted Cash Flow (DCF) - (USD MM)
| Year | AY1 2020 |
AY2 2021 |
AY3 2022 |
AY4 2023 |
AY5 2024 |
FY1 2025 |
FY2 2026 |
FY3 2027 |
FY4 2028 |
FY5 2029 |
|---|---|---|---|---|---|---|---|---|---|---|
| Revenue | 2,934.7 | 3,088.6 | 3,699.8 | 2,810.6 | 6,064.9 | 7,596.3 | 9,514.4 | 11,916.7 | 14,925.6 | 18,694.3 |
| Revenue Growth, % | 0 | 5.24 | 19.79 | -24.03 | 115.79 | 25.25 | 25.25 | 25.25 | 25.25 | 25.25 |
| EBITDA | 861.8 | 820.1 | 897.3 | -329.5 | -1,583.4 | 643.2 | 805.6 | 1,009.1 | 1,263.8 | 1,583.0 |
| EBITDA, % | 29.36 | 26.55 | 24.25 | -11.72 | -26.11 | 8.47 | 8.47 | 8.47 | 8.47 | 8.47 |
| Depreciation | 38.8 | 39.9 | 40.8 | 42.1 | 43.0 | 90.0 | 112.7 | 141.2 | 176.8 | 221.5 |
| Depreciation, % | 1.32 | 1.29 | 1.1 | 1.5 | 0.70916 | 1.18 | 1.18 | 1.18 | 1.18 | 1.18 |
| EBIT | 822.9 | 780.2 | 856.5 | -371.6 | -1,626.4 | 553.2 | 692.9 | 867.9 | 1,087.0 | 1,361.5 |
| EBIT, % | 28.04 | 25.26 | 23.15 | -13.22 | -26.82 | 7.28 | 7.28 | 7.28 | 7.28 | 7.28 |
| Total Cash | 3,614.9 | 2,948.7 | 4,765.1 | 3,856.5 | 3,025.4 | 6,766.1 | 8,474.5 | 10,614.3 | 13,294.4 | 16,651.2 |
| Total Cash, percent | .0 | .0 | .0 | .0 | .0 | .0 | .0 | .0 | .0 | .0 |
| Account Receivables | 51.5 | 79.1 | 89.5 | 42.0 | 663.2 | 291.1 | 364.6 | 456.7 | 572.0 | 716.5 |
| Account Receivables, % | 1.75 | 2.56 | 2.42 | 1.49 | 10.94 | 3.83 | 3.83 | 3.83 | 3.83 | 3.83 |
| Inventories | 7,798.2 | 16,117.3 | 16,843.7 | 17,034.7 | 10,779.5 | 7,596.3 | 9,514.4 | 11,916.7 | 14,925.6 | 18,694.3 |
| Inventories, % | 265.72 | 521.84 | 455.26 | 606.09 | 177.73 | 100 | 100 | 100 | 100 | 100 |
| Accounts Payable | 643.2 | 1,539.1 | 1,606.5 | 1,503.5 | 1,436.0 | 2,922.2 | 3,660.0 | 4,584.2 | 5,741.7 | 7,191.4 |
| Accounts Payable, % | 21.92 | 49.83 | 43.42 | 53.49 | 23.68 | 38.47 | 38.47 | 38.47 | 38.47 | 38.47 |
| Capital Expenditure | -5.3 | -4.9 | -17.0 | -18.1 | -45.3 | -33.2 | -41.6 | -52.1 | -65.3 | -81.8 |
| Capital Expenditure, % | -0.17934 | -0.15877 | -0.45866 | -0.64396 | -0.74715 | -0.43758 | -0.43758 | -0.43758 | -0.43758 | -0.43758 |
| Tax Rate, % | 9.22 | 9.22 | 9.22 | 9.22 | 9.22 | 9.22 | 9.22 | 9.22 | 9.22 | 9.22 |
| EBITAT | 653.6 | 561.3 | 490.5 | -560.0 | -1,476.4 | 441.9 | 553.5 | 693.3 | 868.3 | 1,087.6 |
| Depreciation | ||||||||||
| Changes in Account Receivables | ||||||||||
| Changes in Inventories | ||||||||||
| Changes in Accounts Payable | ||||||||||
| Capital Expenditure | ||||||||||
| UFCF | -6,519.3 | -6,854.5 | -155.0 | -782.5 | 4,087.7 | 5,540.2 | -629.1 | -788.0 | -986.9 | -1,236.1 |
| WACC, % | 7.39 | 7.33 | 7.2 | 7.57 | 7.49 | 7.4 | 7.4 | 7.4 | 7.4 | 7.4 |
| PV UFCF | ||||||||||
| SUM PV UFCF | 2,370.0 | |||||||||
| Long Term Growth Rate, % | 3.00 | |||||||||
| Free cash flow (T + 1) | -1,273 | |||||||||
| Terminal Value | -28,960 | |||||||||
| Present Terminal Value | -20,270 | |||||||||
| Enterprise Value | -17,900 | |||||||||
| Net Debt | 969 | |||||||||
| Equity Value | -18,869 | |||||||||
| Diluted Shares Outstanding, MM | 1,350 | |||||||||
| Equity Value Per Share | -13.98 |
Your Benefits
- Adjustable Forecast Parameters: Effortlessly modify assumptions (growth %, margins, WACC) to explore various scenarios.
- Comprehensive Data Set: Shenzhen Zhenye (Group) Co., Ltd.'s financial data pre-loaded to expedite your analysis.
- Automated DCF Calculations: The model computes Net Present Value (NPV) and intrinsic value automatically.
- Professional and Tailorable: A refined Excel template that customizes to suit your valuation requirements.
- Designed for Analysts and Investors: Perfect for evaluating projections, confirming strategies, and enhancing efficiency.
Key Features
- Real-Life 000006SZ Data: Pre-loaded with Shenzhen Zhenye's historical financials and forward-looking forecasts.
- Fully Customizable Inputs: Tailor revenue growth, profit margins, WACC, tax rates, and capital expenditures to your preferences.
- Dynamic Valuation Model: Automatically recalculates Net Present Value (NPV) and intrinsic value based on your defined inputs.
- Scenario Testing: Develop multiple forecasting scenarios to explore various valuation results.
- User-Friendly Design: Intuitive layout crafted for both professionals and newcomers.
How It Functions
- Download the Template: Gain immediate access to the Excel-based Shenzhen Zhenye (Group) Co., Ltd. DCF Calculator.
- Enter Your Assumptions: Modify the yellow-highlighted cells for growth rates, WACC, profit margins, and additional variables.
- Real-time Calculations: The model automatically refreshes to reflect the intrinsic value of Shenzhen Zhenye (Group) Co., Ltd.
- Explore Scenarios: Test various assumptions to assess potential changes in valuation.
- Evaluate and Decide: Leverage the outcomes to inform your investment or financial decisions.
Why Opt for Shenzhen Zhenye (Group) Co., Ltd. [000006SZ]?
- All-in-One Solution: Combines comprehensive DCF, WACC, and financial ratio analyses in a single platform.
- Flexible Customization: Modify inputs in the highlighted areas to explore different financial scenarios.
- In-Depth Analysis: Automatically computes the intrinsic value and Net Present Value for Shenzhen Zhenye.
- Preloaded Financial Data: Historical and projected data provide a reliable foundation for analysis.
- Expert Level Quality: Perfect for financial analysts, investors, and business consultants alike.
Who Should Use This Product?
- Individual Investors: Gain insights to make educated choices regarding investments in Shenzhen Zhenye (Group) Co.,Ltd. (000006SZ).
- Financial Analysts: Enhance valuation methods with accessible financial models tailored for the company.
- Consultants: Provide clients with precise and timely valuation analyses related to Shenzhen Zhenye (Group) Co.,Ltd. (000006SZ).
- Business Owners: Learn how major corporations like Shenzhen Zhenye (Group) Co.,Ltd. (000006SZ) are valued to inform your own business strategies.
- Finance Students: Explore valuation methodologies through practical data and real-world examples related to the company.
What the Template Contains
- Historical Data: Includes Shenzhen Zhenye’s past financials and baseline forecasts.
- DCF and Levered DCF Models: Detailed templates to calculate Shenzhen Zhenye's intrinsic value.
- WACC Sheet: Pre-built calculations for Weighted Average Cost of Capital.
- Editable Inputs: Modify key drivers such as growth rates, EBITDA %, and CAPEX assumptions.
- Quarterly and Annual Statements: A complete breakdown of Shenzhen Zhenye’s financials.
- Interactive Dashboard: Visualize valuation results and projections dynamically.
Disclaimer
All information, articles, and product details provided on this website are for general informational and educational purposes only. We do not claim any ownership over, nor do we intend to infringe upon, any trademarks, copyrights, logos, brand names, or other intellectual property mentioned or depicted on this site. Such intellectual property remains the property of its respective owners, and any references here are made solely for identification or informational purposes, without implying any affiliation, endorsement, or partnership.
We make no representations or warranties, express or implied, regarding the accuracy, completeness, or suitability of any content or products presented. Nothing on this website should be construed as legal, tax, investment, financial, medical, or other professional advice. In addition, no part of this site—including articles or product references—constitutes a solicitation, recommendation, endorsement, advertisement, or offer to buy or sell any securities, franchises, or other financial instruments, particularly in jurisdictions where such activity would be unlawful.
All content is of a general nature and may not address the specific circumstances of any individual or entity. It is not a substitute for professional advice or services. Any actions you take based on the information provided here are strictly at your own risk. You accept full responsibility for any decisions or outcomes arising from your use of this website and agree to release us from any liability in connection with your use of, or reliance upon, the content or products found herein.