
|
Propiedades de shenzhen & Resources Development Ltd. (000011.sz) Valoración de DCF |
Completamente Editable: Adáptelo A Sus Necesidades En Excel O Sheets
Diseño Profesional: Plantillas Confiables Y Estándares De La Industria
Predeterminadas Para Un Uso Rápido Y Eficiente
Compatible con MAC / PC, completamente desbloqueado
No Se Necesita Experiencia; Fáciles De Seguir
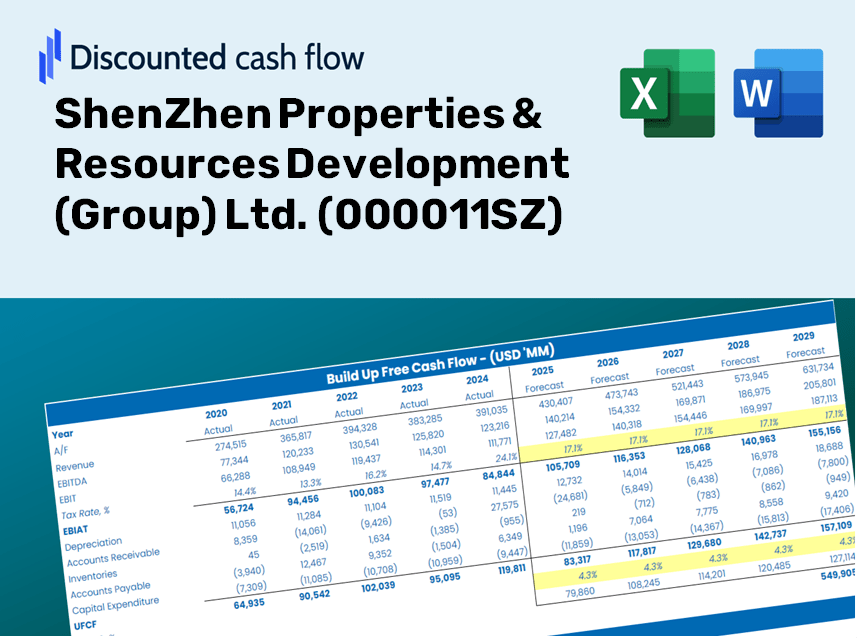
ShenZhen Properties & Resources Development (Group) Ltd. (000011.SZ) Bundle
Descubra el verdadero valor de las propiedades de Shenzhen & ¡Desarrollo de recursos (Grupo) Ltd. (000011SZ) con nuestra calculadora DCF de grado profesional! Ajuste los supuestos clave, explore varios escenarios y evalúe cómo los cambios afectan la valoración de las propiedades de Shenzhen & Desarrollo de recursos (Grupo) Ltd. (000011SZ): todo dentro de una sola plantilla de Excel.
Discounted Cash Flow (DCF) - (USD MM)
| Year | AY1 2020 |
AY2 2021 |
AY3 2022 |
AY4 2023 |
AY5 2024 |
FY1 2025 |
FY2 2026 |
FY3 2027 |
FY4 2028 |
FY5 2029 |
|---|---|---|---|---|---|---|---|---|---|---|
| Revenue | 4,104.4 | 4,492.0 | 3,708.7 | 2,965.1 | 2,734.2 | 2,489.2 | 2,266.2 | 2,063.2 | 1,878.4 | 1,710.1 |
| Revenue Growth, % | 0 | 9.44 | -17.44 | -20.05 | -7.79 | -8.96 | -8.96 | -8.96 | -8.96 | -8.96 |
| EBITDA | 1,266.9 | 1,492.6 | 941.4 | 846.2 | -1,059.3 | 394.7 | 359.3 | 327.1 | 297.8 | 271.1 |
| EBITDA, % | 30.87 | 33.23 | 25.38 | 28.54 | -38.74 | 15.85 | 15.85 | 15.85 | 15.85 | 15.85 |
| Depreciation | 49.3 | 73.1 | 120.0 | 81.5 | 66.1 | 55.9 | 50.9 | 46.3 | 42.2 | 38.4 |
| Depreciation, % | 1.2 | 1.63 | 3.24 | 2.75 | 2.42 | 2.25 | 2.25 | 2.25 | 2.25 | 2.25 |
| EBIT | 1,217.5 | 1,419.5 | 821.5 | 764.7 | -1,125.4 | 338.7 | 308.4 | 280.8 | 255.6 | 232.7 |
| EBIT, % | 29.66 | 31.6 | 22.15 | 25.79 | -41.16 | 13.61 | 13.61 | 13.61 | 13.61 | 13.61 |
| Total Cash | 4,206.3 | 2,171.8 | 1,517.5 | 2,748.8 | 1,678.1 | 1,709.3 | 1,556.2 | 1,416.8 | 1,289.9 | 1,174.3 |
| Total Cash, percent | .0 | .0 | .0 | .0 | .0 | .0 | .0 | .0 | .0 | .0 |
| Account Receivables | 976.7 | 294.2 | 421.0 | 503.7 | 749.8 | 428.7 | 390.3 | 355.3 | 323.5 | 294.5 |
| Account Receivables, % | 23.8 | 6.55 | 11.35 | 16.99 | 27.42 | 17.22 | 17.22 | 17.22 | 17.22 | 17.22 |
| Inventories | 5,312.5 | 9,123.9 | 10,975.3 | 11,098.2 | 10,685.0 | 2,489.2 | 2,266.2 | 2,063.2 | 1,878.4 | 1,710.1 |
| Inventories, % | 129.43 | 203.12 | 295.94 | 374.29 | 390.8 | 100 | 100 | 100 | 100 | 100 |
| Accounts Payable | 468.3 | 351.9 | 608.3 | 662.9 | 1,043.1 | 478.7 | 435.8 | 396.8 | 361.2 | 328.9 |
| Accounts Payable, % | 11.41 | 7.83 | 16.4 | 22.36 | 38.15 | 19.23 | 19.23 | 19.23 | 19.23 | 19.23 |
| Capital Expenditure | -48.5 | -22.6 | -17.7 | -7.6 | -10.3 | -13.9 | -12.7 | -11.5 | -10.5 | -9.6 |
| Capital Expenditure, % | -1.18 | -0.50271 | -0.47818 | -0.25773 | -0.37832 | -0.55964 | -0.55964 | -0.55964 | -0.55964 | -0.55964 |
| Tax Rate, % | 6.62 | 6.62 | 6.62 | 6.62 | 6.62 | 6.62 | 6.62 | 6.62 | 6.62 | 6.62 |
| EBITAT | 940.2 | 1,107.7 | 587.9 | 502.0 | -1,050.9 | 261.4 | 238.0 | 216.7 | 197.3 | 179.6 |
| Depreciation | ||||||||||
| Changes in Account Receivables | ||||||||||
| Changes in Inventories | ||||||||||
| Changes in Accounts Payable | ||||||||||
| Capital Expenditure | ||||||||||
| UFCF | -4,879.9 | -2,087.1 | -1,031.7 | 425.0 | -447.9 | 8,255.9 | 494.7 | 450.4 | 410.1 | 373.3 |
| WACC, % | 4.33 | 4.35 | 4.24 | 4.14 | 4.6 | 4.33 | 4.33 | 4.33 | 4.33 | 4.33 |
| PV UFCF | ||||||||||
| SUM PV UFCF | 9,412.4 | |||||||||
| Long Term Growth Rate, % | 2.00 | |||||||||
| Free cash flow (T + 1) | 381 | |||||||||
| Terminal Value | 16,331 | |||||||||
| Present Terminal Value | 13,211 | |||||||||
| Enterprise Value | 22,623 | |||||||||
| Net Debt | 3,278 | |||||||||
| Equity Value | 19,345 | |||||||||
| Diluted Shares Outstanding, MM | 596 | |||||||||
| Equity Value Per Share | 32.46 |
Benefits of Our Offerings
- Authentic 000011SZ Financial Data: Includes comprehensive historical and forecasted data for accurate assessments.
- Completely Customizable Template: Effortlessly adjust essential parameters such as revenue growth, WACC, and EBITDA percentage.
- Instant Calculations: Observe real-time updates of 000011SZ’s intrinsic value as you make modifications.
- Professional Valuation Solution: Tailored for investors, analysts, and consultants aiming for precise DCF evaluations.
- User-Friendly Interface: A streamlined layout and straightforward guidance suitable for all skill levels.
Key Features
- Authentic Financial Data: Gain access to precise pre-loaded historical figures and forecasts for ShenZhen Properties & Resources Development (Group) Ltd. (000011SZ).
- Adjustable Forecast Inputs: Modify highlighted fields for crucial metrics like WACC, growth rates, and profit margins.
- Real-Time Calculations: Automatic recalculations for DCF, Net Present Value (NPV), and cash flow assessments.
- Intuitive Visual Dashboard: User-friendly charts and summaries that facilitate valuation visualization.
- Designed for Everyone: A straightforward, accessible format tailored for investors, CFOs, and consultants alike.
Our Process
- Step 1: Download the Excel file.
- Step 2: Examine the pre-filled data for ShenZhen Properties & Resources Development (Group) Ltd. (000011SZ) including historical trends and future projections.
- Step 3: Modify the key assumptions (highlighted in yellow) according to your analysis.
- Step 4: Observe real-time updates on ShenZhen Properties & Resources Development's (Group) intrinsic value.
- Step 5: Leverage the results for strategic investment decisions or reporting purposes.
Why Choose ShenZhen Properties & Resources Development (Group) Ltd. (000011SZ) Calculator?
- Save Time: Jump straight into valuation without the hassle of building a DCF model from the ground up.
- Enhance Accuracy: Utilize dependable financial data and formulas to minimize valuation errors.
- Completely Customizable: Adjust the model to align with your specific assumptions and forecasts.
- User-Friendly: Intuitive charts and outputs facilitate straightforward analysis of results.
- Endorsed by Professionals: Crafted for experts who prioritize precision and efficiency.
Who Should Consider This Offering?
- Real Estate Investors: Create comprehensive and dependable property valuation models for investment assessments.
- Corporate Finance Departments: Evaluate market scenarios to inform strategic decisions within the firm.
- Consultants and Financial Advisors: Deliver precise property valuation insights for ShenZhen Properties & Resources Development (000011SZ).
- Students and Instructors: Utilize authentic market data to enhance learning and practical application of financial modeling.
- Property Enthusiasts: Gain insights into how real estate companies like ShenZhen Properties & Resources Development are valued in the industry.
Contents of the Template
- Pre-Filled Data: Contains historical financials and projections for ShenZhen Properties & Resources Development (Group) Ltd. (000011SZ).
- Discounted Cash Flow Model: An editable DCF valuation model that features automatic calculations.
- Weighted Average Cost of Capital (WACC): A specialized sheet for determining WACC using custom parameters.
- Key Financial Ratios: Assess the profitability, efficiency, and leverage of ShenZhen Properties & Resources Development (Group) Ltd. (000011SZ).
- Customizable Inputs: Easily modify revenue growth, margins, and tax rates.
- Clear Dashboard: Visual summaries in charts and tables presenting key valuation outcomes.
Disclaimer
All information, articles, and product details provided on this website are for general informational and educational purposes only. We do not claim any ownership over, nor do we intend to infringe upon, any trademarks, copyrights, logos, brand names, or other intellectual property mentioned or depicted on this site. Such intellectual property remains the property of its respective owners, and any references here are made solely for identification or informational purposes, without implying any affiliation, endorsement, or partnership.
We make no representations or warranties, express or implied, regarding the accuracy, completeness, or suitability of any content or products presented. Nothing on this website should be construed as legal, tax, investment, financial, medical, or other professional advice. In addition, no part of this site—including articles or product references—constitutes a solicitation, recommendation, endorsement, advertisement, or offer to buy or sell any securities, franchises, or other financial instruments, particularly in jurisdictions where such activity would be unlawful.
All content is of a general nature and may not address the specific circumstances of any individual or entity. It is not a substitute for professional advice or services. Any actions you take based on the information provided here are strictly at your own risk. You accept full responsibility for any decisions or outcomes arising from your use of this website and agree to release us from any liability in connection with your use of, or reliance upon, the content or products found herein.