
|
Guangdong Electric Power Development Co., Ltd. (000539.sz) Valoración de DCF |
Completamente Editable: Adáptelo A Sus Necesidades En Excel O Sheets
Diseño Profesional: Plantillas Confiables Y Estándares De La Industria
Predeterminadas Para Un Uso Rápido Y Eficiente
Compatible con MAC / PC, completamente desbloqueado
No Se Necesita Experiencia; Fáciles De Seguir
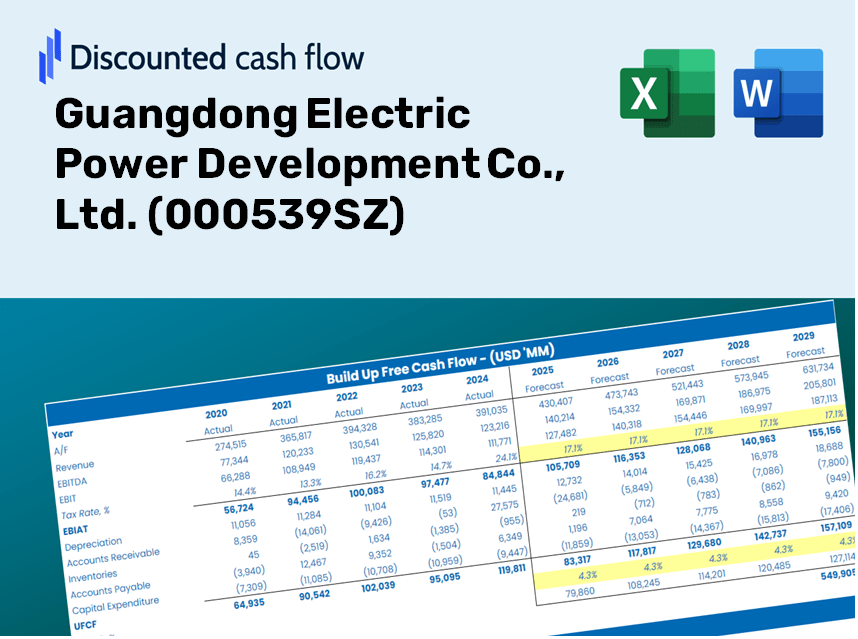
Guangdong Electric Power Development Co., Ltd. (000539.SZ) Bundle
¡Simplifique la valoración de Guangdong Electric Power Development Co., Ltd. (000539SZ) con esta calculadora DCF personalizable! Con Real Guangdong Electric Power Development Co., Ltd. (000539SZ) financieras y entradas de pronóstico ajustables, puede probar escenarios y descubrir Guangdong Electric Power Development Co., Ltd. (000539SZ) valor razonable en minutos.
Discounted Cash Flow (DCF) - (USD MM)
| Year | AY1 2020 |
AY2 2021 |
AY3 2022 |
AY4 2023 |
AY5 2024 |
FY1 2025 |
FY2 2026 |
FY3 2027 |
FY4 2028 |
FY5 2029 |
|---|---|---|---|---|---|---|---|---|---|---|
| Revenue | 33,602.9 | 44,457.9 | 52,661.1 | 59,708.4 | 57,159.1 | 65,714.1 | 75,549.5 | 86,857.0 | 99,857.0 | 114,802.6 |
| Revenue Growth, % | 0 | 32.3 | 18.45 | 13.38 | -4.27 | 14.97 | 14.97 | 14.97 | 14.97 | 14.97 |
| EBITDA | 9,174.5 | -259.2 | 1,824.8 | 10,520.7 | 9,556.3 | 8,480.2 | 9,749.5 | 11,208.7 | 12,886.3 | 14,815.0 |
| EBITDA, % | 27.3 | -0.58293 | 3.47 | 17.62 | 16.72 | 12.9 | 12.9 | 12.9 | 12.9 | 12.9 |
| Depreciation | 3,915.3 | 4,120.6 | 4,723.7 | 4,978.6 | 5,291.3 | 6,240.9 | 7,175.0 | 8,248.9 | 9,483.5 | 10,902.9 |
| Depreciation, % | 11.65 | 9.27 | 8.97 | 8.34 | 9.26 | 9.5 | 9.5 | 9.5 | 9.5 | 9.5 |
| EBIT | 5,259.2 | -4,379.8 | -2,898.8 | 5,542.1 | 4,265.0 | 2,239.3 | 2,574.5 | 2,959.8 | 3,402.8 | 3,912.1 |
| EBIT, % | 15.65 | -9.85 | -5.5 | 9.28 | 7.46 | 3.41 | 3.41 | 3.41 | 3.41 | 3.41 |
| Total Cash | 5,790.9 | 8,105.3 | 11,503.5 | 16,431.4 | 15,361.8 | 14,681.1 | 16,878.4 | 19,404.6 | 22,308.9 | 25,647.9 |
| Total Cash, percent | .0 | .0 | .0 | .0 | .0 | .0 | .0 | .0 | .0 | .0 |
| Account Receivables | 5,290.5 | 10,742.9 | 8,521.0 | 8,970.7 | 9,636.5 | 11,562.1 | 13,292.6 | 15,282.1 | 17,569.3 | 20,198.9 |
| Account Receivables, % | 15.74 | 24.16 | 16.18 | 15.02 | 16.86 | 17.59 | 17.59 | 17.59 | 17.59 | 17.59 |
| Inventories | 1,589.9 | 2,998.9 | 3,376.9 | 2,655.5 | 2,577.1 | 3,528.2 | 4,056.3 | 4,663.4 | 5,361.4 | 6,163.9 |
| Inventories, % | 4.73 | 6.75 | 6.41 | 4.45 | 4.51 | 5.37 | 5.37 | 5.37 | 5.37 | 5.37 |
| Accounts Payable | 4,652.7 | 8,535.3 | 7,434.0 | 4,802.3 | 6,381.3 | 8,722.7 | 10,028.2 | 11,529.2 | 13,254.7 | 15,238.6 |
| Accounts Payable, % | 13.85 | 19.2 | 14.12 | 8.04 | 11.16 | 13.27 | 13.27 | 13.27 | 13.27 | 13.27 |
| Capital Expenditure | -7,978.5 | -10,732.3 | -14,599.4 | -21,715.7 | -15,161.9 | -18,203.1 | -20,927.6 | -24,059.8 | -27,660.8 | -31,800.8 |
| Capital Expenditure, % | -23.74 | -24.14 | -27.72 | -36.37 | -26.53 | -27.7 | -27.7 | -27.7 | -27.7 | -27.7 |
| Tax Rate, % | 60.72 | 60.72 | 60.72 | 60.72 | 60.72 | 60.72 | 60.72 | 60.72 | 60.72 | 60.72 |
| EBITAT | 2,543.2 | -2,685.0 | -1,972.1 | 2,236.0 | 1,675.4 | 1,152.4 | 1,324.9 | 1,523.2 | 1,751.2 | 2,013.3 |
| Depreciation | ||||||||||
| Changes in Account Receivables | ||||||||||
| Changes in Inventories | ||||||||||
| Changes in Accounts Payable | ||||||||||
| Capital Expenditure | ||||||||||
| UFCF | -3,747.7 | -12,275.4 | -11,105.1 | -16,861.2 | -7,203.5 | -11,345.0 | -13,380.7 | -15,383.4 | -17,685.8 | -20,332.8 |
| WACC, % | 2.44 | 2.81 | 3.01 | 2.2 | 2.17 | 2.53 | 2.53 | 2.53 | 2.53 | 2.53 |
| PV UFCF | ||||||||||
| SUM PV UFCF | -72,021.5 | |||||||||
| Long Term Growth Rate, % | 2.00 | |||||||||
| Free cash flow (T + 1) | -20,740 | |||||||||
| Terminal Value | -3,935,074 | |||||||||
| Present Terminal Value | -3,473,447 | |||||||||
| Enterprise Value | -3,545,469 | |||||||||
| Net Debt | 91,772 | |||||||||
| Equity Value | -3,637,241 | |||||||||
| Diluted Shares Outstanding, MM | 5,357 | |||||||||
| Equity Value Per Share | -678.98 |
Benefits You Will Receive
- Comprehensive 000539SZ Financial Data: Access historical and projected figures for precise valuation.
- Customizable Parameters: Adjust WACC, tax rates, revenue growth, and capital expenditures to suit your analysis.
- Automated Calculations: Intrinsic value and NPV are computed in real-time.
- Scenario Analysis: Evaluate various scenarios to forecast the future performance of Guangdong Electric Power Development Co., Ltd.
- User-Friendly Design: Expertly designed for professionals while remaining approachable for newcomers.
Key Features
- 🔍 Real-Life 000539 Financials: Pre-filled historical and projected data for Guangdong Electric Power Development Co., Ltd.
- ✏️ Fully Customizable Inputs: Adjust all critical parameters (yellow cells) such as WACC, growth %, and tax rates.
- 📊 Professional DCF Valuation: Built-in formulas calculate the intrinsic value of Guangdong Electric using the Discounted Cash Flow method.
- ⚡ Instant Results: Visualize Guangdong Electric's valuation instantly after making adjustments.
- Scenario Analysis: Test and compare outcomes for various financial assumptions side-by-side.
How It Works
- Step 1: Download the Excel file.
- Step 2: Review the pre-filled data for Guangdong Electric Power Development Co., Ltd. (000539SZ) including historical and projected figures.
- Step 3: Modify the key assumptions (highlighted in yellow) according to your analysis.
- Step 4: Observe automatic recalculations reflecting the intrinsic value of Guangdong Electric Power Development Co., Ltd. (000539SZ).
- Step 5: Utilize the results for making informed investment decisions or for reporting purposes.
Why Choose This Calculator?
- Designed for Professionals: A sophisticated tool utilized by industry analysts, CFOs, and consultants.
- Accurate Data: Guangdong Electric Power Development Co., Ltd.’s (000539SZ) historical and projected financials are preloaded for precision.
- Flexible Scenario Testing: Effortlessly simulate various forecasts and assumptions.
- Comprehensive Outputs: Instantly calculates intrinsic value, NPV, and other essential metrics.
- User-Friendly: Detailed step-by-step instructions make the process straightforward.
Who Can Benefit from This Product?
- Institutional Investors: Create comprehensive and dependable valuation models for their portfolio evaluations.
- Corporate Strategy Teams: Examine valuation scenarios to inform and refine internal business strategies.
- Financial Consultants and Advisors: Deliver precise valuation insights for Guangdong Electric Power Development Co., Ltd. (000539SZ) to clients.
- Academic Professionals and Students: Leverage real market data for hands-on learning and teaching of financial modeling principles.
- Power Sector Enthusiasts: Gain insights into how companies like Guangdong Electric Power Development Co., Ltd. (000539SZ) are valued within the industry.
Contents of the Template
- Comprehensive DCF Model: An editable template featuring in-depth valuation calculations.
- Real-World Data: Historical and projected financials for Guangdong Electric Power Development Co., Ltd. (000539SZ) preloaded for analysis.
- Customizable Parameters: Modify WACC, growth rates, and tax assumptions for scenario testing.
- Financial Statements: Complete annual and quarterly breakdowns for enhanced insights.
- Key Ratios: Integrated analysis for profitability, efficiency, and leverage metrics.
- Dashboard with Visual Outputs: Offers charts and tables for clear and actionable results.
Disclaimer
All information, articles, and product details provided on this website are for general informational and educational purposes only. We do not claim any ownership over, nor do we intend to infringe upon, any trademarks, copyrights, logos, brand names, or other intellectual property mentioned or depicted on this site. Such intellectual property remains the property of its respective owners, and any references here are made solely for identification or informational purposes, without implying any affiliation, endorsement, or partnership.
We make no representations or warranties, express or implied, regarding the accuracy, completeness, or suitability of any content or products presented. Nothing on this website should be construed as legal, tax, investment, financial, medical, or other professional advice. In addition, no part of this site—including articles or product references—constitutes a solicitation, recommendation, endorsement, advertisement, or offer to buy or sell any securities, franchises, or other financial instruments, particularly in jurisdictions where such activity would be unlawful.
All content is of a general nature and may not address the specific circumstances of any individual or entity. It is not a substitute for professional advice or services. Any actions you take based on the information provided here are strictly at your own risk. You accept full responsibility for any decisions or outcomes arising from your use of this website and agree to release us from any liability in connection with your use of, or reliance upon, the content or products found herein.