
|
Haima Automobile Co., Ltd (000572.sz) Valoración de DCF |
Completamente Editable: Adáptelo A Sus Necesidades En Excel O Sheets
Diseño Profesional: Plantillas Confiables Y Estándares De La Industria
Predeterminadas Para Un Uso Rápido Y Eficiente
Compatible con MAC / PC, completamente desbloqueado
No Se Necesita Experiencia; Fáciles De Seguir
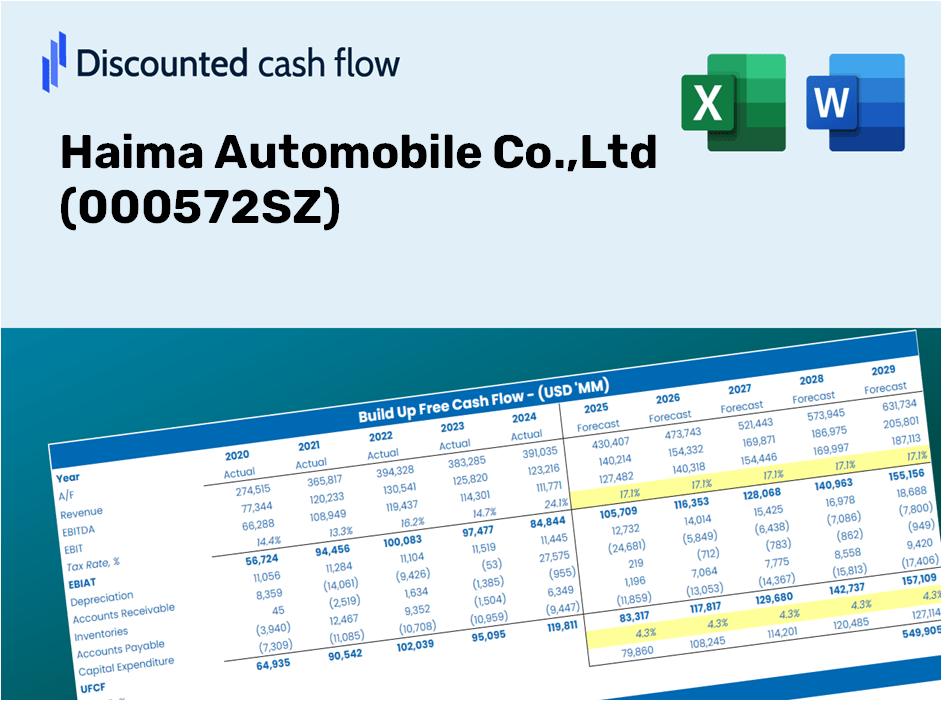
Haima Automobile Co.,Ltd (000572.SZ) Bundle
Ya sea que sea un inversor o analista, esta calculadora DCF (000572SZ) es su recurso de referencia para una valoración precisa. Cargados con datos reales de Haima Automobile Co., Ltd, puede ajustar los pronósticos y observar los efectos en tiempo real.
What You Will Receive
- Authentic Haima Data: Comprehensive financials – including revenue and EBIT – based on real and forecasted figures.
- Complete Customization: Modify essential parameters (highlighted cells) such as WACC, growth %, and tax rates.
- Immediate Valuation Adjustments: Automatic updates to assess the effects of changes on Haima’s fair value.
- Flexible Excel Template: Designed for swift modifications, scenario analysis, and in-depth forecasts.
- Efficient and Reliable: Avoid starting from scratch while ensuring accuracy and adaptability.
Key Features
- Accurate Financial Data for Haima: Access reliable pre-loaded historical figures and future forecasts tailored for Haima Automobile Co., Ltd (000572SZ).
- Adjustable Forecast Parameters: Modify editable fields highlighted in yellow, including WACC, growth rates, and profit margins.
- Real-time Calculations: Automatic updates for DCF, Net Present Value (NPV), and cash flow assessments.
- User-Friendly Dashboard: Intuitive charts and summaries to help you visualize your valuation outcomes.
- Suitable for All Levels: A straightforward, user-friendly framework designed for investors, CFOs, and consultants alike.
How It Works
- Step 1: Download the Excel file.
- Step 2: Review the pre-filled data for Haima Automobile Co., Ltd (000572SZ) (historical and forecasted).
- Step 3: Modify key assumptions (highlighted in yellow) based on your analysis.
- Step 4: Observe the automatic recalculations for Haima's intrinsic value.
- Step 5: Utilize the results for your investment strategies or reporting needs.
Why Opt for Haima's Financial Calculator?
- Precision: Utilizes accurate financial data from Haima Automobile Co., Ltd for reliable results.
- Customizability: Built for users to easily experiment and adjust input variables.
- Efficiency: Eliminate the need to create a DCF model from the ground up.
- Expert-Quality: Crafted with the utmost attention to detail, suitable for CFO-level analysis.
- Intuitive: Simple interface designed for users of all skill levels, including those new to financial modeling.
Who Can Benefit from Haima Automobile Co., Ltd (000572SZ)?
- Investors: Make informed decisions with a high-quality valuation tool tailored for the automotive industry.
- Financial Analysts: Streamline your process with an easily customizable DCF model specific to Haima Automobile's performance.
- Consultants: Modify the template effortlessly for engaging client presentations or comprehensive reports.
- Automotive Finance Enthusiasts: Enhance your knowledge of valuation methods through practical, real-world examples related to Haima Automobile.
- Educators and Students: Utilize it as an effective learning resource in finance and automotive-related courses.
Components of the Template
- Comprehensive DCF Model: Customizable template featuring in-depth valuation calculations.
- Real-World Data: Haima Automobile Co., Ltd's historical and forecasted financials preloaded for thorough analysis.
- Customizable Parameters: Modify WACC, growth rates, and tax assumptions to explore different scenarios.
- Financial Statements: Complete annual and quarterly breakdowns for enhanced insights.
- Key Ratios: Integrated analysis of profitability, efficiency, and financial leverage.
- Dashboard with Visual Outputs: Visualizations and tables for straightforward, actionable results.
Disclaimer
All information, articles, and product details provided on this website are for general informational and educational purposes only. We do not claim any ownership over, nor do we intend to infringe upon, any trademarks, copyrights, logos, brand names, or other intellectual property mentioned or depicted on this site. Such intellectual property remains the property of its respective owners, and any references here are made solely for identification or informational purposes, without implying any affiliation, endorsement, or partnership.
We make no representations or warranties, express or implied, regarding the accuracy, completeness, or suitability of any content or products presented. Nothing on this website should be construed as legal, tax, investment, financial, medical, or other professional advice. In addition, no part of this site—including articles or product references—constitutes a solicitation, recommendation, endorsement, advertisement, or offer to buy or sell any securities, franchises, or other financial instruments, particularly in jurisdictions where such activity would be unlawful.
All content is of a general nature and may not address the specific circumstances of any individual or entity. It is not a substitute for professional advice or services. Any actions you take based on the information provided here are strictly at your own risk. You accept full responsibility for any decisions or outcomes arising from your use of this website and agree to release us from any liability in connection with your use of, or reliance upon, the content or products found herein.