
|
Shengda Resources Co., Ltd. (000603.sz) valoración de DCF |
Completamente Editable: Adáptelo A Sus Necesidades En Excel O Sheets
Diseño Profesional: Plantillas Confiables Y Estándares De La Industria
Predeterminadas Para Un Uso Rápido Y Eficiente
Compatible con MAC / PC, completamente desbloqueado
No Se Necesita Experiencia; Fáciles De Seguir
Shengda Resources Co.,Ltd. (000603.SZ) Bundle
Mejore sus estrategias de inversión con Shengda Resources Co., Ltd. (000603SZ) ¡Calculadora DCF! Explore datos financieros reales, ajuste las predicciones y gastos de crecimiento, y observe instantáneamente cómo estas alteraciones influyen en el valor intrínseco de Shengda Resources Co., Ltd. (000603SZ).
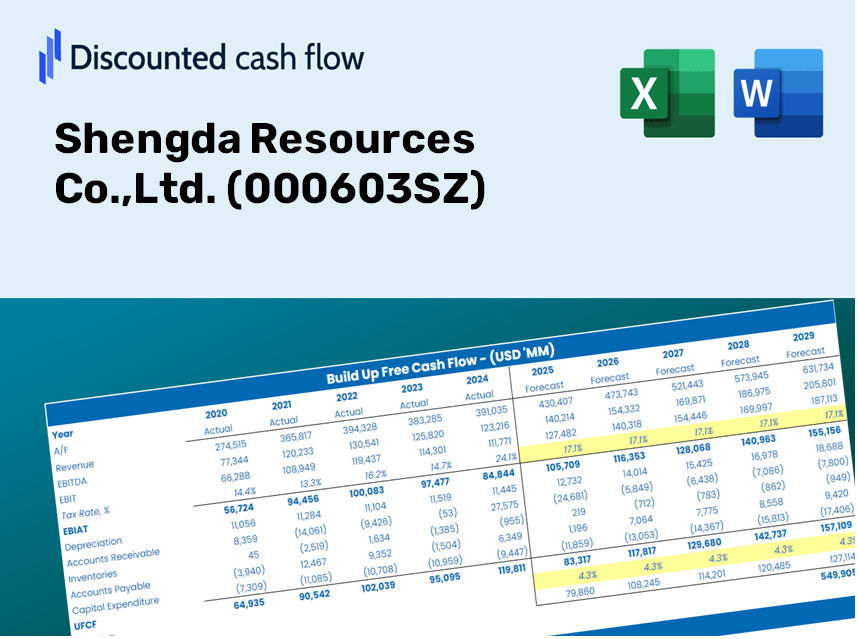
Discounted Cash Flow (DCF) - (USD MM)
| Year | AY1 2020 |
AY2 2021 |
AY3 2022 |
AY4 2023 |
AY5 2024 |
FY1 2025 |
FY2 2026 |
FY3 2027 |
FY4 2028 |
FY5 2029 |
|---|---|---|---|---|---|---|---|---|---|---|
| Revenue | 1,637.8 | 1,638.0 | 1,879.2 | 2,253.5 | 2,013.2 | 2,134.0 | 2,262.0 | 2,397.7 | 2,541.5 | 2,693.9 |
| Revenue Growth, % | 0 | 0.01423777 | 14.73 | 19.92 | -10.66 | 6 | 6 | 6 | 6 | 6 |
| EBITDA | 605.6 | 913.9 | 815.9 | 479.3 | 712.5 | 823.1 | 872.4 | 924.8 | 980.2 | 1,039.0 |
| EBITDA, % | 36.98 | 55.8 | 43.42 | 21.27 | 35.39 | 38.57 | 38.57 | 38.57 | 38.57 | 38.57 |
| Depreciation | 101.9 | 134.2 | 176.5 | 194.1 | 204.2 | 181.7 | 192.6 | 204.1 | 216.4 | 229.3 |
| Depreciation, % | 6.22 | 8.19 | 9.39 | 8.62 | 10.15 | 8.51 | 8.51 | 8.51 | 8.51 | 8.51 |
| EBIT | 503.7 | 779.8 | 639.4 | 285.2 | 508.2 | 641.4 | 679.9 | 720.7 | 763.9 | 809.7 |
| EBIT, % | 30.75 | 47.61 | 34.03 | 12.65 | 25.25 | 30.06 | 30.06 | 30.06 | 30.06 | 30.06 |
| Total Cash | 1,161.5 | 724.6 | 632.7 | 792.2 | 1,308.3 | 1,062.6 | 1,126.3 | 1,193.9 | 1,265.5 | 1,341.4 |
| Total Cash, percent | .0 | .0 | .0 | .0 | .0 | .0 | .0 | .0 | .0 | .0 |
| Account Receivables | 33.2 | 726.5 | 650.3 | 701.7 | 99.5 | 499.6 | 529.6 | 561.3 | 595.0 | 630.7 |
| Account Receivables, % | 2.03 | 44.35 | 34.6 | 31.14 | 4.94 | 23.41 | 23.41 | 23.41 | 23.41 | 23.41 |
| Inventories | 126.5 | 214.1 | 244.6 | 245.9 | 334.0 | 261.7 | 277.4 | 294.0 | 311.7 | 330.4 |
| Inventories, % | 7.73 | 13.07 | 13.02 | 10.91 | 16.59 | 12.26 | 12.26 | 12.26 | 12.26 | 12.26 |
| Accounts Payable | 261.6 | 332.5 | 359.8 | 472.0 | 425.1 | 416.0 | 441.0 | 467.5 | 495.5 | 525.2 |
| Accounts Payable, % | 15.97 | 20.3 | 19.15 | 20.95 | 21.12 | 19.5 | 19.5 | 19.5 | 19.5 | 19.5 |
| Capital Expenditure | -270.6 | -252.1 | -223.6 | -294.4 | -551.0 | -359.5 | -381.1 | -404.0 | -428.2 | -453.9 |
| Capital Expenditure, % | -16.52 | -15.39 | -11.9 | -13.06 | -27.37 | -16.85 | -16.85 | -16.85 | -16.85 | -16.85 |
| Tax Rate, % | 30.52 | 30.52 | 30.52 | 30.52 | 30.52 | 30.52 | 30.52 | 30.52 | 30.52 | 30.52 |
| EBITAT | 298.6 | 460.8 | 379.1 | 164.8 | 353.1 | 391.2 | 414.6 | 439.5 | 465.9 | 493.8 |
| Depreciation | ||||||||||
| Changes in Account Receivables | ||||||||||
| Changes in Inventories | ||||||||||
| Changes in Accounts Payable | ||||||||||
| Capital Expenditure | ||||||||||
| UFCF | 231.8 | -367.0 | 405.0 | 124.0 | 473.6 | -123.6 | 205.4 | 217.7 | 230.8 | 244.6 |
| WACC, % | 9.2 | 9.2 | 9.2 | 9.2 | 9.25 | 9.21 | 9.21 | 9.21 | 9.21 | 9.21 |
| PV UFCF | ||||||||||
| SUM PV UFCF | 545.9 | |||||||||
| Long Term Growth Rate, % | 3.00 | |||||||||
| Free cash flow (T + 1) | 252 | |||||||||
| Terminal Value | 4,056 | |||||||||
| Present Terminal Value | 2,611 | |||||||||
| Enterprise Value | 3,156 | |||||||||
| Net Debt | 215 | |||||||||
| Equity Value | 2,941 | |||||||||
| Diluted Shares Outstanding, MM | 690 | |||||||||
| Equity Value Per Share | 4.26 |
Benefits You Will Receive
- Adjustable Forecast Inputs: Seamlessly modify assumptions (growth %, margins, WACC) to develop various scenarios.
- Genuine Market Data: Shengda Resources Co., Ltd. (000603SZ) financial data pre-loaded to enhance your analysis.
- Automated DCF Calculations: The template computes Net Present Value (NPV) and intrinsic value automatically.
- Tailored and Professional Design: A refined Excel model that aligns with your valuation requirements.
- Designed for Analysts and Investors: Perfect for evaluating projections, confirming strategies, and optimizing time efficiency.
Key Features
- Customizable Forecast Parameters: Adjust essential inputs such as revenue growth, EBITDA %, and capital expenditures for accurate projections.
- Instant DCF Valuation: Automatically computes intrinsic value, NPV, and additional financial metrics without delay.
- High-Precision Results: Leverages Shengda Resources Co., Ltd.'s (000603SZ) actual financial data to ensure realistic valuation outputs.
- Simplified Scenario Analysis: Effortlessly evaluate various assumptions and analyze the resulting outcomes.
- Efficiency Booster: Streamline your process by avoiding the tedious task of building intricate valuation models from the ground up.
How It Works
- 1. Access the Template: Download and open the Excel file featuring Shengda Resources Co., Ltd.'s preloaded data.
- 2. Modify Key Assumptions: Adjust critical inputs such as growth rates, WACC, and capital expenditures.
- 3. View Immediate Results: The DCF model will automatically calculate intrinsic value and NPV.
- 4. Explore Different Scenarios: Analyze various forecasts to understand different valuation outcomes.
- 5. Present with Confidence: Share professional valuation insights to inform your strategic decisions.
Why Choose This Calculator for Shengda Resources Co., Ltd. (000603SZ)?
- All-in-One Solution: Features DCF, WACC, and financial ratio evaluations all in one integrated tool.
- Flexible Inputs: Modify the yellow-highlighted fields to explore different financial scenarios.
- In-Depth Analysis: Automatically computes the intrinsic value and Net Present Value for Shengda Resources Co., Ltd.
- Preloaded Information: Historical and projected data provides a reliable foundation for analysis.
- High-Quality Standards: Perfect for financial analysts, investors, and business advisors focusing on Shengda Resources Co., Ltd.
Who Can Benefit from Shengda Resources Co., Ltd. (000603SZ)?
- Investors: Make informed decisions using our expert-level valuation resources.
- Financial Analysts: Streamline your workflow with our customizable DCF model.
- Consultants: Efficiently modify the template for client presentations or analytical reports.
- Finance Enthusiasts: Enhance your knowledge of valuation methods through practical, real-life examples.
- Educators and Students: Utilize our tools as a hands-on learning resource in finance courses.
Contents of the Template
- Pre-Filled Data: Contains Shengda Resources Co., Ltd.'s historical financial performance and projections.
- Discounted Cash Flow Model: Customizable DCF valuation model featuring automatic calculations.
- Weighted Average Cost of Capital (WACC): A specific sheet designed for calculating WACC using personalized inputs.
- Key Financial Ratios: Evaluate Shengda's profitability, efficiency, and financial leverage.
- Customizable Inputs: Easily modify growth rates, profit margins, and tax assumptions.
- Clear Dashboard: Visual representations including charts and tables summarizing essential valuation insights.
Disclaimer
All information, articles, and product details provided on this website are for general informational and educational purposes only. We do not claim any ownership over, nor do we intend to infringe upon, any trademarks, copyrights, logos, brand names, or other intellectual property mentioned or depicted on this site. Such intellectual property remains the property of its respective owners, and any references here are made solely for identification or informational purposes, without implying any affiliation, endorsement, or partnership.
We make no representations or warranties, express or implied, regarding the accuracy, completeness, or suitability of any content or products presented. Nothing on this website should be construed as legal, tax, investment, financial, medical, or other professional advice. In addition, no part of this site—including articles or product references—constitutes a solicitation, recommendation, endorsement, advertisement, or offer to buy or sell any securities, franchises, or other financial instruments, particularly in jurisdictions where such activity would be unlawful.
All content is of a general nature and may not address the specific circumstances of any individual or entity. It is not a substitute for professional advice or services. Any actions you take based on the information provided here are strictly at your own risk. You accept full responsibility for any decisions or outcomes arising from your use of this website and agree to release us from any liability in connection with your use of, or reliance upon, the content or products found herein.