
|
Hubei BioCause Pharmaceutical Co., Ltd. (000627.SZ) Valoración de DCF |
Completamente Editable: Adáptelo A Sus Necesidades En Excel O Sheets
Diseño Profesional: Plantillas Confiables Y Estándares De La Industria
Predeterminadas Para Un Uso Rápido Y Eficiente
Compatible con MAC / PC, completamente desbloqueado
No Se Necesita Experiencia; Fáciles De Seguir
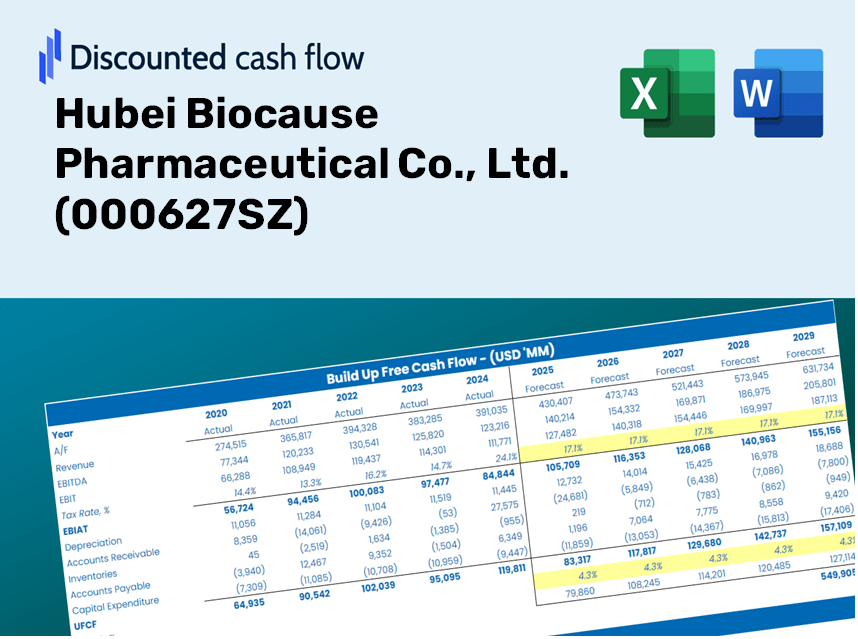
Hubei Biocause Pharmaceutical Co., Ltd. (000627.SZ) Bundle
¡Mejore sus estrategias de inversión con la calculadora DCF (000627SZ)! Explore la genuina Hubei Biocause Pharmaceutical Co., Ltd. Financials, ajuste las proyecciones y gastos de crecimiento, y observa instantáneamente cómo estas modificaciones afectan el valor intrínseco de (000627SZ).
Discounted Cash Flow (DCF) - (USD MM)
| Year | AY1 2019 |
AY2 2020 |
AY3 2021 |
AY4 2022 |
AY5 2023 |
FY1 2024 |
FY2 2025 |
FY3 2026 |
FY4 2027 |
FY5 2028 |
|---|---|---|---|---|---|---|---|---|---|---|
| Revenue | 50,192.1 | 43,576.0 | 49,583.2 | 49,615.7 | 49,698.9 | 49,802.9 | 49,907.1 | 50,011.6 | 50,116.3 | 50,221.2 |
| Revenue Growth, % | 0 | -13.18 | 13.79 | 0.06555509 | 0.16765 | 0.20931 | 0.20931 | 0.20931 | 0.20931 | 0.20931 |
| EBITDA | 3,677.3 | 2,932.3 | 31,981.6 | 726.5 | 1,216.3 | 8,214.3 | 8,231.5 | 8,248.7 | 8,266.0 | 8,283.3 |
| EBITDA, % | 7.33 | 6.73 | 64.5 | 1.46 | 2.45 | 16.49 | 16.49 | 16.49 | 16.49 | 16.49 |
| Depreciation | 91.4 | 79.6 | 151.2 | 166.6 | 165.2 | 133.3 | 133.6 | 133.8 | 134.1 | 134.4 |
| Depreciation, % | 0.18213 | 0.18273 | 0.30495 | 0.33579 | 0.3324 | 0.2676 | 0.2676 | 0.2676 | 0.2676 | 0.2676 |
| EBIT | 3,585.9 | 2,852.7 | 31,830.4 | 559.9 | 1,051.1 | 8,081.0 | 8,097.9 | 8,114.9 | 8,131.9 | 8,148.9 |
| EBIT, % | 7.14 | 6.55 | 64.2 | 1.13 | 2.11 | 16.23 | 16.23 | 16.23 | 16.23 | 16.23 |
| Total Cash | 15,203.5 | 30,248.8 | 26,157.8 | 28,391.8 | 29,952.0 | 26,888.9 | 26,945.1 | 27,001.5 | 27,058.0 | 27,114.7 |
| Total Cash, percent | .0 | .0 | .0 | .0 | .0 | .0 | .0 | .0 | .0 | .0 |
| Account Receivables | .0 | .0 | .0 | 16,999.1 | .0 | 3,412.6 | 3,419.8 | 3,426.9 | 3,434.1 | 3,441.3 |
| Account Receivables, % | 0 | 0 | 0 | 34.26 | 0 | 6.85 | 6.85 | 6.85 | 6.85 | 6.85 |
| Inventories | 3,671.6 | 10,716.2 | 10,224.5 | 10,504.0 | .0 | 7,340.8 | 7,356.2 | 7,371.6 | 7,387.0 | 7,402.4 |
| Inventories, % | 7.32 | 24.59 | 20.62 | 21.17 | 0 | 14.74 | 14.74 | 14.74 | 14.74 | 14.74 |
| Accounts Payable | 156.5 | 35.0 | 93.5 | 206.9 | 949.0 | 289.6 | 290.2 | 290.8 | 291.4 | 292.0 |
| Accounts Payable, % | 0.31183 | 0.08034644 | 0.18859 | 0.417 | 1.91 | 0.58147 | 0.58147 | 0.58147 | 0.58147 | 0.58147 |
| Capital Expenditure | -717.1 | -308.4 | -287.1 | -135.1 | -67.5 | -311.1 | -311.8 | -312.4 | -313.1 | -313.7 |
| Capital Expenditure, % | -1.43 | -0.70776 | -0.57909 | -0.27221 | -0.13588 | -0.62473 | -0.62473 | -0.62473 | -0.62473 | -0.62473 |
| Tax Rate, % | 65.11 | 65.11 | 65.11 | 65.11 | 65.11 | 65.11 | 65.11 | 65.11 | 65.11 | 65.11 |
| EBITAT | 2,880.3 | 2,200.1 | 81,655.0 | 1,272.0 | 366.7 | 6,341.0 | 6,354.3 | 6,367.6 | 6,380.9 | 6,394.3 |
| Depreciation | ||||||||||
| Changes in Account Receivables | ||||||||||
| Changes in Inventories | ||||||||||
| Changes in Accounts Payable | ||||||||||
| Capital Expenditure | ||||||||||
| UFCF | -1,260.4 | -5,194.8 | 82,069.3 | -15,861.7 | 28,709.6 | -5,249.7 | 6,154.2 | 6,167.0 | 6,180.0 | 6,192.9 |
| WACC, % | 3.98 | 3.89 | 4.55 | 4.55 | 2.68 | 3.93 | 3.93 | 3.93 | 3.93 | 3.93 |
| PV UFCF | ||||||||||
| SUM PV UFCF | 16,543.3 | |||||||||
| Long Term Growth Rate, % | 2.00 | |||||||||
| Free cash flow (T + 1) | 6,317 | |||||||||
| Terminal Value | 327,102 | |||||||||
| Present Terminal Value | 269,746 | |||||||||
| Enterprise Value | 286,290 | |||||||||
| Net Debt | -2,735 | |||||||||
| Equity Value | 289,024 | |||||||||
| Diluted Shares Outstanding, MM | 5,014 | |||||||||
| Equity Value Per Share | 57.65 |
What You Will Receive
- Customizable Excel Template: A fully adjustable Excel-based DCF Calculator featuring pre-loaded financials for Hubei Biocause Pharmaceutical Co., Ltd. (000627SZ).
- Comprehensive Data: Access to historical figures and projected estimates (indicated in the highlighted cells).
- Adjustable Forecasts: Modify key assumptions such as revenue growth, EBITDA %, and WACC.
- Instant Calculations: Quickly visualize the effects of your inputs on the valuation of Hubei Biocause Pharmaceutical Co., Ltd. (000627SZ).
- Professional Resource: Designed for investors, CFOs, consultants, and financial analysts.
- User-Friendly Format: Organized for clarity and simplicity, complete with easy-to-follow instructions.
Key Features
- Comprehensive Historical Data: Pre-loaded with Hubei Biocause Pharmaceutical's (000627SZ) past financial performance and anticipated forecasts.
- Fully Customizable Variables: Tailor inputs such as revenue growth, profit margins, discount rates, tax rates, and capital investment.
- Responsive Valuation Model: Automatic recalculations of Net Present Value (NPV) and intrinsic value based on your specified inputs.
- Scenario Analysis: Develop various forecasting scenarios to evaluate different valuation results.
- Intuitive User Interface: Designed to be straightforward and accessible, catering to both experienced professionals and newcomers.
How It Functions
- Download the Template: Gain immediate access to the Excel-based Hubei Biocause Pharmaceutical DCF Calculator.
- Enter Your Assumptions: Modify the yellow-highlighted cells for growth rates, WACC, profit margins, and more.
- Instant Calculations: The model will automatically calculate the intrinsic value of Hubei Biocause Pharmaceutical.
- Test Scenarios: Experiment with various assumptions to assess potential changes in valuation.
- Analyze and Decide: Leverage the results to inform your investment strategies or financial assessments.
Why Select Hubei Biocause Pharmaceutical Co., Ltd. Calculator?
- Comprehensive Analysis: Features DCF, WACC, and financial ratio evaluations all in one tool.
- Flexible Inputs: Modify the highlighted fields to explore various financial scenarios.
- In-depth Evaluations: Automatically computes the intrinsic value and Net Present Value for Hubei Biocause (000627SZ).
- Preloaded Information: Access to historical and projected data for precise assessments.
- High Professional Standards: Perfect for financial analysts, investors, and business consultants focused on Hubei Biocause (000627SZ).
Who Should Utilize This Product?
- Investors: Assess Hubei Biocause Pharmaceutical Co., Ltd.'s ([000627SZ]) valuation before making investment decisions.
- CFOs and Financial Analysts: Enhance valuation procedures and evaluate financial projections for ([000627SZ]).
- Startup Founders: Gain insights into how publicly traded companies like Hubei Biocause ([000627SZ]) determine their value.
- Consultants: Produce comprehensive valuation reports for clients focused on ([000627SZ]).
- Students and Educators: Utilize real market data to practice and teach valuation methodologies relevant to ([000627SZ]).
What the Template Includes
- Operating and Balance Sheet Data: Pre-filled historical data and forecasts for Hubei Biocause Pharmaceutical Co., Ltd. (000627SZ), covering metrics such as revenue, EBITDA, EBIT, and capital expenditures.
- WACC Calculation: A dedicated sheet for Weighted Average Cost of Capital (WACC), featuring key parameters like Beta, risk-free rate, and share price.
- DCF Valuation (Unlevered and Levered): Customizable Discounted Cash Flow models providing intrinsic value assessments along with comprehensive calculations.
- Financial Statements: Pre-loaded annual and quarterly financial statements to facilitate thorough analysis.
- Key Ratios: Contains profitability, leverage, and efficiency ratios specific to Hubei Biocause Pharmaceutical Co., Ltd. (000627SZ).
- Dashboard and Charts: Visual representation of valuation outputs and assumptions, enabling easy analysis of results.
Disclaimer
All information, articles, and product details provided on this website are for general informational and educational purposes only. We do not claim any ownership over, nor do we intend to infringe upon, any trademarks, copyrights, logos, brand names, or other intellectual property mentioned or depicted on this site. Such intellectual property remains the property of its respective owners, and any references here are made solely for identification or informational purposes, without implying any affiliation, endorsement, or partnership.
We make no representations or warranties, express or implied, regarding the accuracy, completeness, or suitability of any content or products presented. Nothing on this website should be construed as legal, tax, investment, financial, medical, or other professional advice. In addition, no part of this site—including articles or product references—constitutes a solicitation, recommendation, endorsement, advertisement, or offer to buy or sell any securities, franchises, or other financial instruments, particularly in jurisdictions where such activity would be unlawful.
All content is of a general nature and may not address the specific circumstances of any individual or entity. It is not a substitute for professional advice or services. Any actions you take based on the information provided here are strictly at your own risk. You accept full responsibility for any decisions or outcomes arising from your use of this website and agree to release us from any liability in connection with your use of, or reliance upon, the content or products found herein.