
|
Jinke Property Group Co., Ltd. (000656.sz) Valoración de DCF |
Completamente Editable: Adáptelo A Sus Necesidades En Excel O Sheets
Diseño Profesional: Plantillas Confiables Y Estándares De La Industria
Predeterminadas Para Un Uso Rápido Y Eficiente
Compatible con MAC / PC, completamente desbloqueado
No Se Necesita Experiencia; Fáciles De Seguir
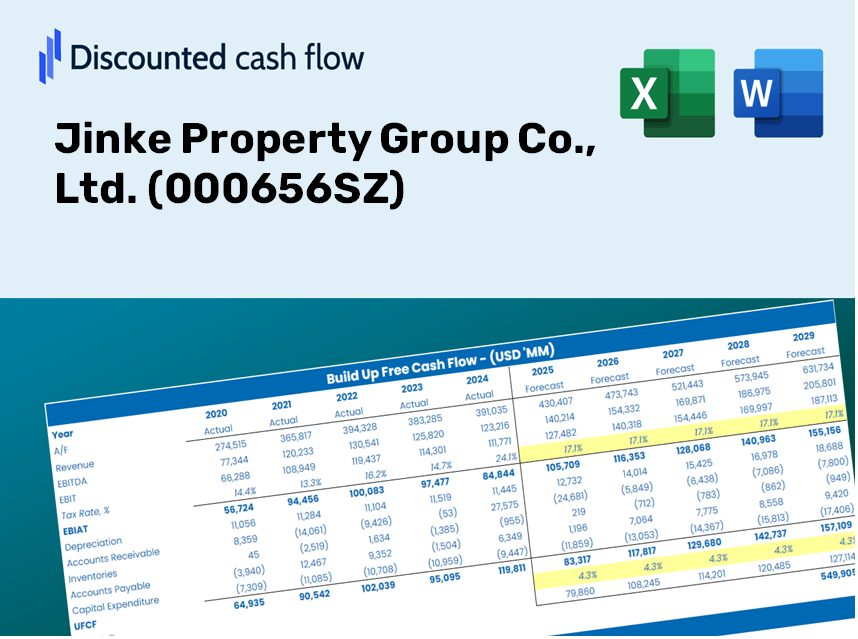
Jinke Property Group Co., Ltd. (000656.SZ) Bundle
Diseñada para la precisión, nuestra calculadora DCF (000656SZ) le permite evaluar Jinke Property Group Co., Ltd. Valoración utilizando datos financieros actualizados y ofrece una flexibilidad completa para modificar todos los parámetros esenciales para mejorar las proyecciones.
Discounted Cash Flow (DCF) - (USD MM)
| Year | AY1 2020 |
AY2 2021 |
AY3 2022 |
AY4 2023 |
AY5 2024 |
FY1 2025 |
FY2 2026 |
FY3 2027 |
FY4 2028 |
FY5 2029 |
|---|---|---|---|---|---|---|---|---|---|---|
| Revenue | 87,704.4 | 112,309.7 | 54,861.9 | 63,238.2 | 27,554.8 | 23,128.5 | 19,413.1 | 16,294.6 | 13,677.1 | 11,480.0 |
| Revenue Growth, % | 0 | 28.05 | -51.15 | 15.27 | -56.43 | -16.06 | -16.06 | -16.06 | -16.06 | -16.06 |
| EBITDA | 10,963.3 | 7,742.3 | -19,828.5 | -719.6 | -15,523.0 | -3,433.3 | -2,881.8 | -2,418.8 | -2,030.3 | -1,704.1 |
| EBITDA, % | 12.5 | 6.89 | -36.14 | -1.14 | -56.34 | -14.84 | -14.84 | -14.84 | -14.84 | -14.84 |
| Depreciation | 301.3 | 234.5 | 211.7 | 182.4 | 145.5 | 81.2 | 68.1 | 57.2 | 48.0 | 40.3 |
| Depreciation, % | 0.34356 | 0.20878 | 0.3859 | 0.28845 | 0.528 | 0.35094 | 0.35094 | 0.35094 | 0.35094 | 0.35094 |
| EBIT | 10,661.9 | 7,507.9 | -20,040.2 | -902.0 | -15,668.5 | -3,514.4 | -2,949.9 | -2,476.0 | -2,078.3 | -1,744.4 |
| EBIT, % | 12.16 | 6.68 | -36.53 | -1.43 | -56.86 | -15.2 | -15.2 | -15.2 | -15.2 | -15.2 |
| Total Cash | 43,560.9 | 28,908.1 | 11,958.5 | 7,037.5 | 2,769.5 | 5,476.1 | 4,596.4 | 3,858.1 | 3,238.3 | 2,718.1 |
| Total Cash, percent | .0 | .0 | .0 | .0 | .0 | .0 | .0 | .0 | .0 | .0 |
| Account Receivables | 3,856.6 | 49,852.0 | 45,086.1 | 31,374.5 | 31,782.2 | 12,978.7 | 10,893.9 | 9,143.9 | 7,675.0 | 6,442.1 |
| Account Receivables, % | 4.4 | 44.39 | 82.18 | 49.61 | 115.34 | 56.12 | 56.12 | 56.12 | 56.12 | 56.12 |
| Inventories | 234,652.7 | 228,114.8 | 184,843.3 | 127,775.7 | 91,538.7 | 23,128.5 | 19,413.1 | 16,294.6 | 13,677.1 | 11,480.0 |
| Inventories, % | 267.55 | 203.11 | 336.92 | 202.05 | 332.21 | 100 | 100 | 100 | 100 | 100 |
| Accounts Payable | 34,263.5 | 35,611.2 | 31,356.6 | 30,950.3 | 30,341.8 | 12,807.3 | 10,750.0 | 9,023.1 | 7,573.6 | 6,357.0 |
| Accounts Payable, % | 39.07 | 31.71 | 57.16 | 48.94 | 110.11 | 55.37 | 55.37 | 55.37 | 55.37 | 55.37 |
| Capital Expenditure | -345.4 | -406.1 | -20.0 | -15.2 | -3.1 | -38.3 | -32.1 | -27.0 | -22.6 | -19.0 |
| Capital Expenditure, % | -0.39387 | -0.36158 | -0.03647857 | -0.02406847 | -0.01116917 | -0.16544 | -0.16544 | -0.16544 | -0.16544 | -0.16544 |
| Tax Rate, % | 6.31 | 6.31 | 6.31 | 6.31 | 6.31 | 6.31 | 6.31 | 6.31 | 6.31 | 6.31 |
| EBITAT | 6,154.3 | 3,151.2 | -17,499.8 | -1,184.2 | -14,679.5 | -2,675.9 | -2,246.1 | -1,885.3 | -1,582.4 | -1,328.2 |
| Depreciation | ||||||||||
| Changes in Account Receivables | ||||||||||
| Changes in Inventories | ||||||||||
| Changes in Accounts Payable | ||||||||||
| Capital Expenditure | ||||||||||
| UFCF | -198,135.5 | -35,130.3 | 26,474.6 | 69,356.1 | 20,683.6 | 67,046.1 | 1,532.8 | 1,286.6 | 1,079.9 | 906.4 |
| WACC, % | 23.09 | 17.78 | 33.07 | 37.34 | 35.21 | 29.3 | 29.3 | 29.3 | 29.3 | 29.3 |
| PV UFCF | ||||||||||
| SUM PV UFCF | 54,003.0 | |||||||||
| Long Term Growth Rate, % | 2.00 | |||||||||
| Free cash flow (T + 1) | 925 | |||||||||
| Terminal Value | 3,387 | |||||||||
| Present Terminal Value | 937 | |||||||||
| Enterprise Value | 54,940 | |||||||||
| Net Debt | 13,658 | |||||||||
| Equity Value | 41,283 | |||||||||
| Diluted Shares Outstanding, MM | 5,293 | |||||||||
| Equity Value Per Share | 7.80 |
What You Will Receive
- Pre-Filled Financial Model: Jinke Property Group’s actual data facilitates accurate DCF valuation.
- Comprehensive Forecast Control: Modify revenue growth, profit margins, WACC, and other essential factors.
- Real-Time Calculations: Automatic updates provide immediate feedback as you make adjustments.
- Investor-Ready Template: A polished Excel file crafted for high-quality valuation.
- Flexible and Reusable: Designed for adaptability, enabling repeat use for in-depth forecasts.
Core Capabilities
- Customizable Financial Inputs: Adjust essential metrics such as revenue growth, EBITDA %, and capital expenditures for tailored forecasts.
- Instant DCF Valuation: Provides real-time calculations of intrinsic value, NPV, and other financial metrics.
- High-Precision Accuracy: Leverages Jinke Property Group Co., Ltd.'s real financial data for credible valuation results.
- Streamlined Scenario Analysis: Easily explore various assumptions and analyze their implications side by side.
- Efficiency Boosting Solution: Removes the hassle of constructing intricate valuation models from the ground up.
How It Operates
- 1. Access the Template: Download and open the Excel file containing Jinke Property Group Co., Ltd.'s preloaded data.
- 2. Modify Assumptions: Adjust critical inputs such as growth rates, WACC, and capital expenditures.
- 3. Analyze Results Immediately: The DCF model automatically computes intrinsic value and NPV.
- 4. Evaluate Scenarios: Compare various forecasts to explore alternative valuation results.
- 5. Present with Assurance: Deliver professional valuation insights that bolster your decision-making.
Why Choose This Calculator for Jinke Property Group (000656SZ)?
- Comprehensive Tool: Incorporates DCF, WACC, and financial ratio analyses all in one solution.
- Customizable Inputs: Easily modify the yellow-highlighted cells to explore different scenarios.
- Detailed Insights: Automatically computes Jinke Property Group's intrinsic value and Net Present Value.
- Preloaded Data: Access to both historical and forecasted data for reliable starting points.
- Professional Quality: Perfect for financial analysts, investors, and business advisors.
Who Can Benefit from Jinke Property Group Co., Ltd. (000656SZ)?
- Investors: Make informed choices with a robust valuation tool designed for investment analysis.
- Financial Analysts: Streamline your workflow with an easily customizable DCF model.
- Consultants: Efficiently modify the template for client presentations or detailed reports.
- Real Estate Enthusiasts: Enhance your comprehension of valuation methods through practical, real-world examples.
- Educators and Students: Utilize this resource as an effective learning aid in finance and real estate courses.
Contents of the Template
- Historical Data: Contains Jinke Property Group's past financials and baseline projections.
- DCF and Levered DCF Models: Comprehensive templates for assessing the intrinsic value of Jinke Property Group (000656SZ).
- WACC Sheet: Pre-structured calculations for Weighted Average Cost of Capital.
- Editable Inputs: Customize key parameters such as growth rates, EBITDA %, and CAPEX assumptions.
- Quarterly and Annual Statements: Detailed analysis of Jinke Property Group's financial performance.
- Interactive Dashboard: Dynamically visualize valuation outcomes and forecasts.
Disclaimer
All information, articles, and product details provided on this website are for general informational and educational purposes only. We do not claim any ownership over, nor do we intend to infringe upon, any trademarks, copyrights, logos, brand names, or other intellectual property mentioned or depicted on this site. Such intellectual property remains the property of its respective owners, and any references here are made solely for identification or informational purposes, without implying any affiliation, endorsement, or partnership.
We make no representations or warranties, express or implied, regarding the accuracy, completeness, or suitability of any content or products presented. Nothing on this website should be construed as legal, tax, investment, financial, medical, or other professional advice. In addition, no part of this site—including articles or product references—constitutes a solicitation, recommendation, endorsement, advertisement, or offer to buy or sell any securities, franchises, or other financial instruments, particularly in jurisdictions where such activity would be unlawful.
All content is of a general nature and may not address the specific circumstances of any individual or entity. It is not a substitute for professional advice or services. Any actions you take based on the information provided here are strictly at your own risk. You accept full responsibility for any decisions or outcomes arising from your use of this website and agree to release us from any liability in connection with your use of, or reliance upon, the content or products found herein.